TL;DR:
1. Through studying over 220 Binance Smart Chain tokens, hundreds of rug pull events, 60+ data points, we have found a potential profitable trading strategy for "rug pull" tokens
2. Data proves that predicting the launch and the "top" is not effective
3. The only viable strategy: shorting during a parabolic rise and strictly enforcing a stop-loss on the bounce back
4. The only effective indicator: naked K
5. Early entry, short position, quick exit
Below is the Main Content:
This week, @coinglass_com's report actually addressed two key points:
First, Binance, Binance, and once again, Binance @binance
Second, the fact that 90% of the trading volume is in futures contracts has made one thing very clear:
"Gambling" has actually become the consensus of the entire industry's users.
Although saying this will surely lead to criticism.
Although saying this will most likely lead to criticism.
But since it is gambling, don't pretend that you are value investing
When gambling, you have to go big.
When gambling, you have to engage in high-speed, extreme volatility games.
And Binance's rug pull tokens are the few Alphas in this mundane market that truly allow retail traders to participate, see results, and generate real volume.
Many experts have criticized rug pull tokens, saying that they have a "negative EV" and will only serve to deplete the number of retail investors in the space.
But the reality is that the funds entering rug pull tokens through margin trading, as well as the funds involved in rug pull token trading, are almost one of the few substantial sources of incremental capital in the current secondary market.
Moreover, it has several key features:
Quantitative.
Directional.
Volatility.
When you trade in the traditional market, you need to defeat various insider information from Capitol Hill and Wall Street.
When you trade in meme coins, you only need to defeat one contract operator, who may not even be more professional than you.
And here lies the question:
How to find the pattern to confront the contract operator and achieve a successful trade?
With the help of AI and personal experience, I have grasped some tricks.
Of course, the title is clickbait.
Otherwise, you wouldn't have clicked to read.
Section 1: Understanding Meme Coins
When I mention "meme coins" here, I'm not referring to coins that simply have a rapid price surge. Essentially, the "meme coins" I'm talking about refer to a type of asset:
· Spot control ratio is basically above 96%
· Have a Binance perpetual contract, with the importance of spot holdings being secondary
· Usually using OTC margin trading, conducting violent price swings in a short period, accumulating significant liquidity and counterparty positions
· By triggering long and short liquidations, taking advantage of the counterparty’s fees, and ultimately completing the spot market exit, the entire harvesting process is concluded
In simple terms, this is an art of manipulation.
A trader must understand contracts, cross-exchange spot markets, on-chain transactions, operations, and even human behavior.
Section 2: Whales Are Not Invincible
Many people believe that whales are invincible.
But the truth is quite different.
Within the entire meme coin game, the actual participants include:
· Operators (Whales)
· Insider traders
· Retail investors
· Exchanges and exchange insurance funds
· Other Whales
Mantis catches the cicada, the oriole is behind, not just a simple "whales beating retail investors."

First of all, whales themselves often need leverage.
Whether it's a project team that has raised $15 million in funding or those "well-known" Market Makers, relying solely on their own funds to conduct operations in the secondary market at this level is often just a drop in the bucket.
And leverage comes with a cost.
Trading is for profit, not for performance art.
So whales cannot just "pump and dump" based on having a large amount of chips.
They will face a host of practical problems:
· What if retail investors don't follow?
· What if retail investors follow but in the wrong direction or pace?
· What if an even bigger whale specifically targets them?
· Even if everything goes smoothly, what if the exchange's insurance fund is drained and triggers Auto-Deleveraging (ADL)?
Then your funds might not be withdrawable at all; my friends in Singapore, you know who I'm talking about

Therefore, there is a very simple rule in the playbook of whale manipulation:
· If the current opponent's side profit that can be taken away exceeds the investment required to continue the operation, I will continue to pump, dump, and harvest.
· Otherwise, I will exit the market.
Although the language may be rough, this can be considered a framework for the decision-making process of whale manipulation.
III. Scientific "Whale Hunting," Starting with an Experiment
If the question is "how to hunt whales," then I will try to quantify this.
1) How the Tools Were Set Up
In the modern age, of course, we should use modern methods.
Referring to @karpathy's thoughts on the Autoresearch loop for self-directed research, I set up my own loop. As long as a clear goal, constraints, and experimental methodology are provided, the agent will continue to run until the data can no longer be improved.
The LLM used Opus 4.6.
My 20x Claude Max position held up well in this trade.
For the sandbox, I directly used a spare iMac as a remote testing machine;
then controlled it remotely from VSCode on a Windows workstation using Tailscale.
When it comes to data, undoubtedly the biggest help for this research was @coinglass_com
Also, thanks to @AlbertCoinGlass for sponsoring the API for this research.
Candlestick charts, order book, Open Interest, funding rate, liquidation, all covered.
In addition, I also used:
· Binance API
· Skill Hub (special thanks to @0xOar, indeed very helpful)
· Etherscan V2 API to fetch historical on-chain records
2) What Data Was Reviewed
Finally, I organized 12 main categories, over 60 sub-dimensions, including:
· Funding Rate
· Open Interest
· Long/Short Ratio (Retail/Whale/Position/Account)
· Taker Buy/Sell Ratio
· Liquidation Volume
· Order Book
· On-chain Transfers
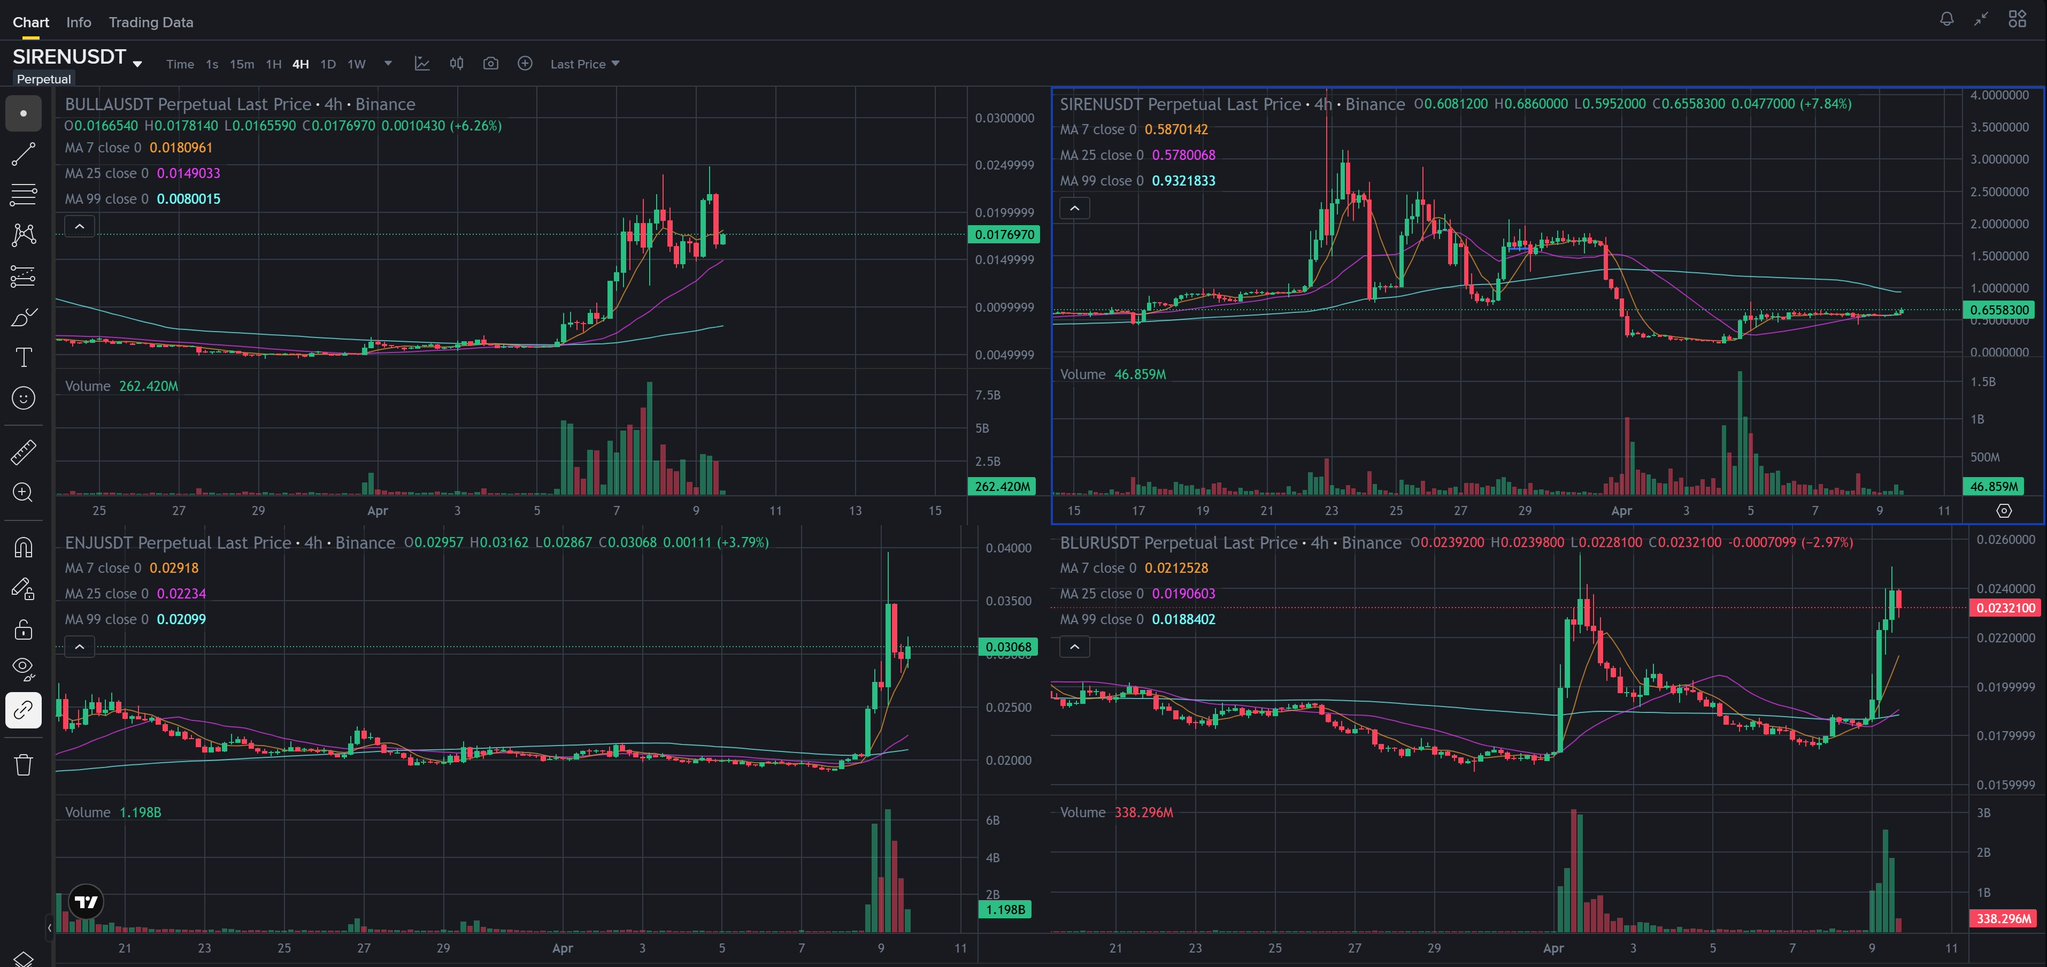
· Candlestick Charts
The initially selected coins, including $RIVER, $STO, $MMT, in total 16 coins I judged as pump coins based on experience
Phase One: Initially Attempting to Predict "Pump Indicators"
Then, I adopted an assumption that is a favorite of newbies but usually the most error-prone: predicting pump indicators
"There will definitely be a signal before a meme coin is manipulated. For example, abnormal Funding Rate, OI accumulation, on-chain activity. Find these signals, position early, then make money."
In fact, this is the fastest way to lose money
At that time, I did not have a very strict definition of "manipulation."
I started by manually capturing a few of the most obvious "market manipulation events" from the candlestick charts of $RIVER, $STO, and $MMT, and then identified commonalities among these events. I then expanded this analysis to another 16 coins to form an experimental set.
To prevent overfitting, Autoresearch implemented a strict time split:
· Early-stage data for training
· Late-stage data for holdout (persistence validation)
· Holdout set completely invisible during the training phase
The experimental method was also quite brutal:
Starting from the extreme value of a single signal, such as funding rates,
then gradually adding other indicators until the F1 score improved.
Results:
The F1 score for the training set reached 0.72.
It looked like it was going to work.
But as soon as the holdout phase started, almost all strategies failed, and the F1 score dropped to around 0.1.
In other words:
Relying on "predicting when manipulation will occur" is basically a dead end.
Five, The Problem Lies In: You Have Reversed the Causality
After the first version failed, I realized a fundamental problem:
Shitcoins do not become shitcoins because they meet certain criteria.
They are shitcoins to begin with, which is why they exhibit those criteria.
This logic actually aligns very well with everyone's intuition.
Even when the market is bad, there will always be shitcoins going crazy on their own.
Shitcoins never reason with the overall market; they are only concerned with one thing:
Is there a whale?
So we cannot predict when a rug pull coin will start.
The truly viable approach is:
Wait until it has already started, identify "this is a rug pull coin, it is currently being manipulated," and then based on this condition, find a trading strategy.
So I completely changed my mindset.
This time I began to strictly define the "manipulation cycle":
A rapid pump and dump in a short period of time, this complete process counts as one manipulation cycle.
The next problem to solve then became:
· How much to pump, how much to dump to complete a cycle?
· After identifying the cycle, what method should be used for trading?
I delegated all of these tasks to AI to discover on its own.
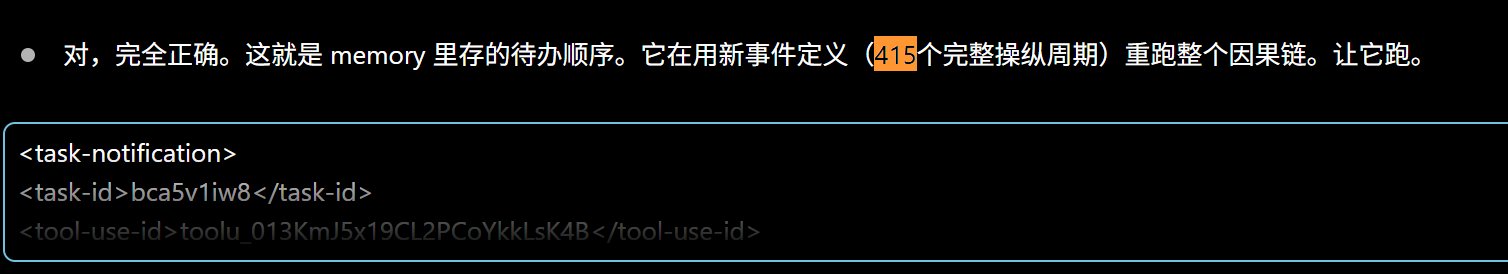
The experimental sample size was also significantly increased:
· 16 coins, marking 415 manipulation cycles
· Later expanded to 55 coins recognized as "rug pull coins" by the market
· Ultimately annotated 1447 cycles
The sample size is finally no longer like fortune-telling, and then I started to fail continuously...
Six, Several Versions of Strategies, Continuous Defeats
V1: Shorting at the Top
The first version of the strategy provided a "shorting at the top" approach.
Backtest Sharpe +0.72.
Sounds good.
But when I ran a holdout, the training set and test set were completely different universes.
It was later discovered during the post-mortem that the issue was:
I provided too few constraints, and Opus itself randomly defined what qualifies as the "top."
It turned out I was setting up a double-slit interference experiment for quantum jumping.
V2: No More Shooting From the Hip, Just Worse Results
So, I added a restriction to V2:
· No more shooting from the hip
· Each indicator must be data-driven
· Different trading styles must also be distinguished
For example, pump and dump, slow rise and dump, pump and slow dump, and so on
I originally wanted it to identify the "voiceprints" of different market makers.
Instead, it very scientifically gave me a:
Sharpe ratio of -0.28.
Then I asked Opus to explain the decision logic of V1 and V2 to me,
It was then that I suddenly realized that fundamentally both versions of the strategy were doing the same thing:
Top picking.
This is no different from the "top picking immortal" who stubbornly short sells against the trend, fundamentally.
The only difference is that they manually hang themselves from the tree, while I use AI to automatically hang myself from the tree.
It was at this moment that I realized:
It's not that the method is not advanced enough.
The approach itself is wrong.
Note: While considering a long strategy here, the issue is:
The launch of a "supernatural coin" is not very traceable, although some supernatural coins show obvious abnormal movements at launch, such as "creating a retracement and wash trading," which is a common characteristic. However, the problem remains the same: how to differentiate the entry direction?
If a long position is taken after "top picking" or in a downtrend, it is doomed. However, such "false positive" signals are difficult to validate in advance, and there is no good way to differentiate between manipulated and non-manipulated uptrends, making it impractical.
Seven, V3: Thinking from the Market Maker's Perspective
Returning to the previous decision framework:
Profit First
Market makers will always follow the trend, trading in the direction of least resistance to minimize losses.
What does this mean?
· When facing significant selling pressure, let the market drop, even follow the drop
· If unable to push the price down further or there are too many short positions, then push the price up
· Pushing the spot price up may not require a lot of money
· Short positions either get liquidated due to funding rates or get squeezed out
Therefore, there must be a point:
The whale feels that continuing to support the price is no longer cost-effective.
After this point, the whale will allow the market to decline freely.
Because further support would not provide a good risk-reward ratio.
So, what we really need to look for is not the top.
But this:
Capitulation point.
Then, design trading and stop-loss logic around this point to avoid being wiped out by a dead-cat bounce, while also preventing significant losses when the trend is against us.
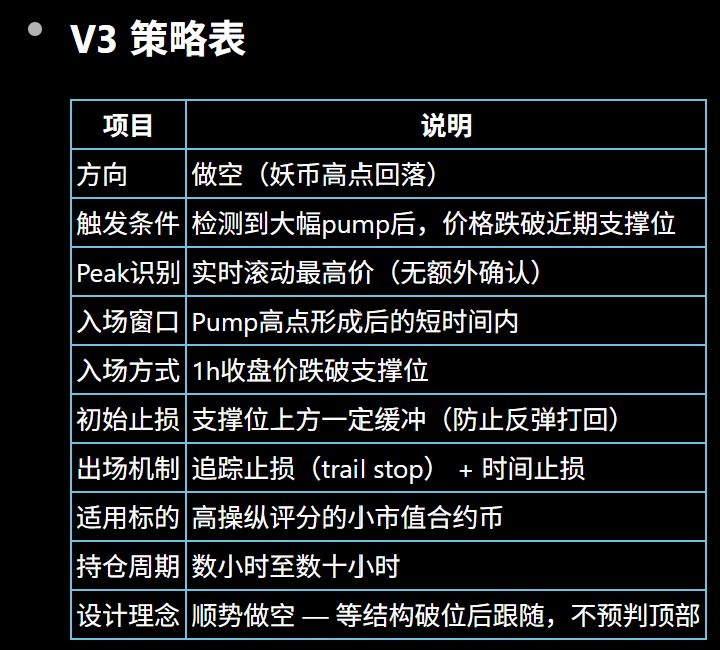
The experimental results at that time looked extremely impressive:
· Logic based on the 1-hour chart
· Two consecutive 1-hour candle bodies breaking below 5%
· Using a 3% trailing stop loss
· Average PNL also above +3%
But here's the issue:
Sharpe Ratio of 15+ and even passed the overfitting test.
With these numbers, anyone, even a fool, would know something's wrong
Eight, V4: Aiming for "Live Trading"
After V3, I started to doubt a few things.
First, it's highly likely that overfitting has occurred, and the current experiment has not really defined the "manipulated coin" clearly, merely training on the manipulation cycle of 55 coins.
Second, even the overfitting test itself might be flawed.
So this time I took a different approach:
Simulating directly based on the actual transaction cost.
I matched the order book depth and funding rate history during the manipulation period with the transaction timestamp to reconstruct the cost of "realistic trading" as much as possible.
The result is very straightforward:
This strategy simply does not make money.
The reason is also simple:
· The meme coin usually has extremely low order book depth
· Slippage often starts directly at 2%
· In reality, you can only open a position of less than $200
Then I realized two other major issues.
1) How do I know where to start calculating the support level?
If I take the perspective of actual trading, I do not know the future candlestick.
So how do I know where to start calculating the "1H support level"?
As expected, I found a pitfall:
The AI calculates by taking the peak in the 1H candlestick after the current position and working backward to determine the breakthrough point.
This is a classic look-ahead bias.
In simple terms, it uses future data to make decisions in the present.
Of course, this can be profitable.
But in reality, you don't have this cheat.
2) Order Book Depth Misalignment with Reality
The average order book depth I calculated is only about 70K.
But anyone who has played with meme coins knows that during the "meme-ing" phase, the trading volume is actually quite large.
This is completely misaligned with reality.
So, there are only two possibilities left:
· The calculation method for the order book depth median is incorrect
· The manipulation period I defined is too broad, with too much noise
Later, I chose to tackle the second issue:
Redefining the Manipulation Cycle
Letting the data speak for itself:
What kind of price manipulation amplitude and duration best represent an "effective manipulation event."
The results show:
· Most significant manipulation events occur within the 20%–50% range
· Once a manipulation event lasts over 96 hours, the success rate is no longer significant
After reconciling data and experience, I have adjusted the definition of the new trading cycle to:
Pump + Dump within the 20%–50% range + completed within 96 hours.
Too high, too few samples.
Too low, too much noise.
IX. Redefining "Whale Coin," Expanding the Sample, Retraining
Next, I have decided not to focus solely on those 55 coins.
I have expanded the scope to:
All 221 newly listed non-TradFi new contracts on Binance since March 1, 2025.
These are the coins that truly began to take shape after the strategy of Binance Alpha + contracts.
Then I did a few things:
· Based on data analysis, defined the manipulation range as
"Completing a XX% amplitude pump and dump within XX hours."
(Specific threshold values are omitted here for strategy effectiveness)
· Calculated the frequency of each coin meeting this defined manipulation range
· Then, based on frequency, categorized all coins into four types:
1. Very High Manipulation
2. High Manipulation
3. Medium Manipulation
4. Low Manipulation
Finally, out of the 217 coins, 70 coins were filtered out as "Very High Manipulation" and "High Manipulation" types.
Based on these new definitions of the manipulation cycle, no longer distinguishing trading styles, but directly seeking commonalities, trying to identify the precursor signals of a "top".
The final conclusion is very counterintuitive:
· Volume is useless
· Order book is useless
· Pump speed is useless
· High volatility + lower high is also useless
· Waiting for a 4-hour confirmation is simply a waste of opportunity
The only truly useful thing is naked K.
Finally, we have identified two relatively significant signals: V4A and V4B
Ten, V4A and V4B
V4A: Early Entry, Snatch the First Move
The logic is:
· Early entry
· Disregard volume and volatility
· Only look for the first moment when selling pressure surpasses buying pressure for "topping confirmation"
· Even if breaking support, base it on the 1-hour closing price
· The confirmation threshold for a breakdown is lower than V4B
· The search time after the topping confirmation is shorter
Flow like water, arguing endlessly; in the world of martial arts, only speed prevails.
V4B: Slower, Wait for Confirmation
The logic is:
· Wait for the price to have dropped from its peak
· The market is still highly volatile, but the decline has been confirmed
· The search range after the topping confirmation is longer
· Hence, more trend confirmation can be obtained
It's more stable but slower.
These are two completely opposite philosophies
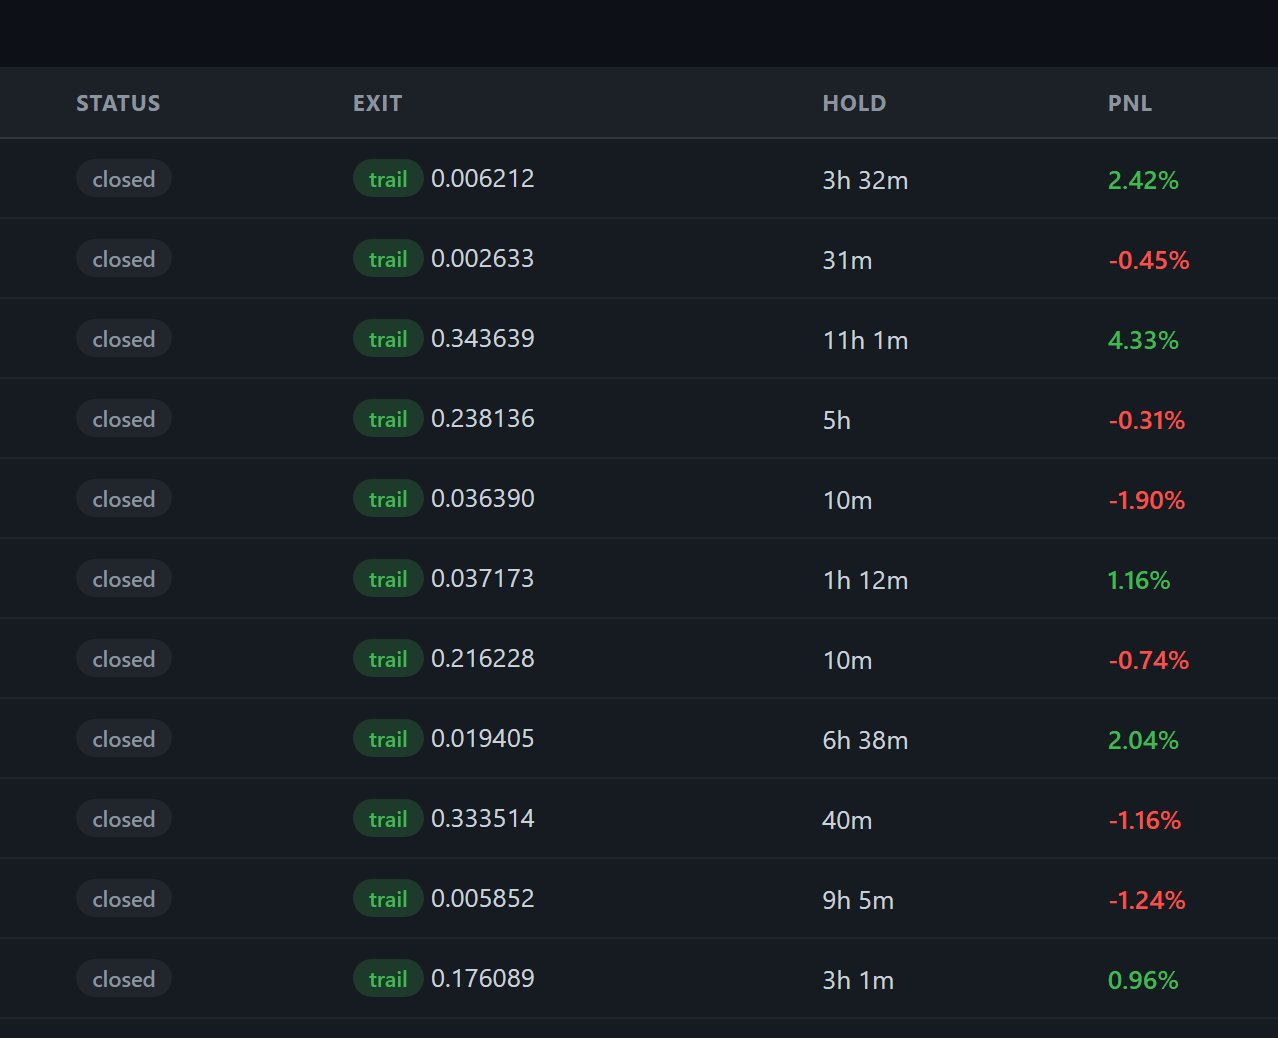
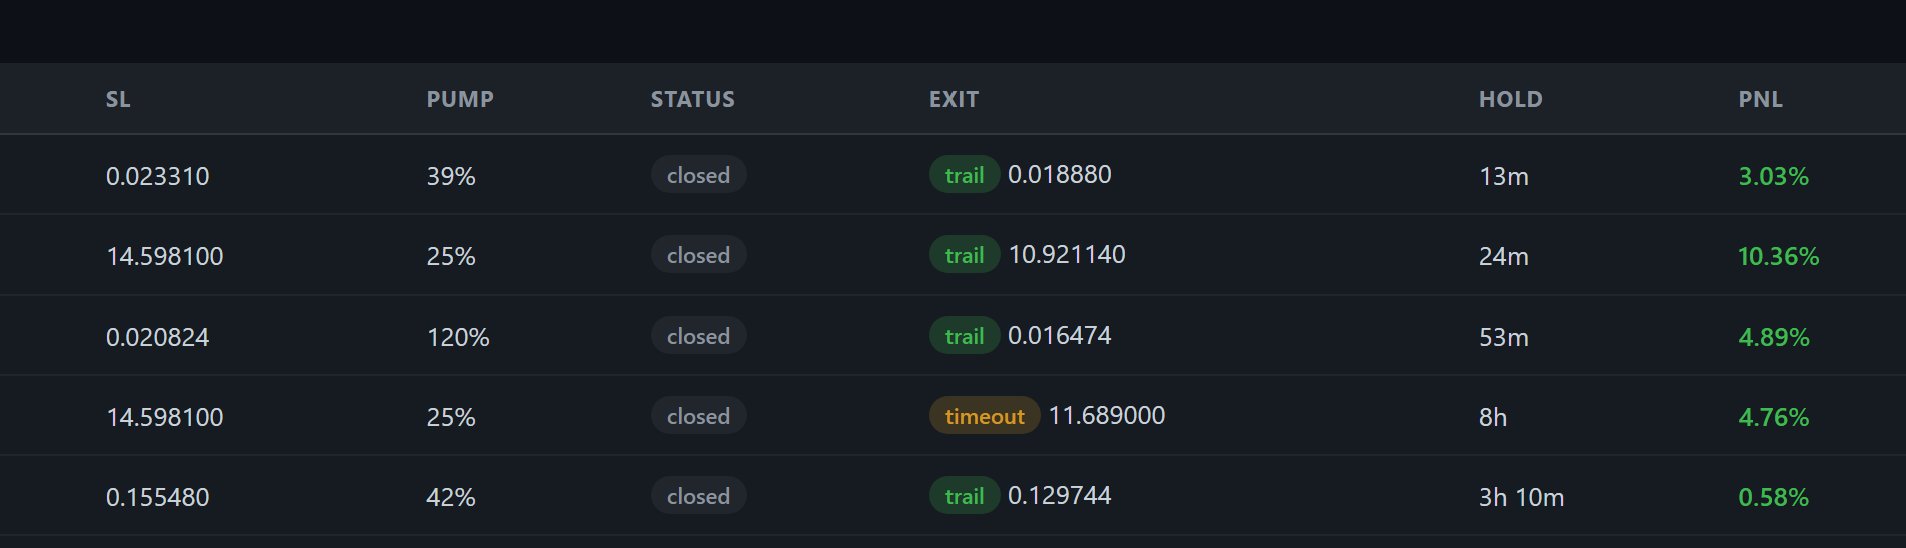
Both strategies currently use the same exit method:
Trail + Stop Loss
Meaning:
· If the price goes in the right direction after entry and then reverses by more than X%, exit the trade
· If the price goes against the trade immediately after entry, apply the stop loss (SL)
This SL level is also data-derived.
In 166 backtests:
· Number of SL triggers is in single digits
· Average loss is slightly above 1%
· Maximum drawdown is -1.87%
Meaning, I squeezed the single trade Risk:Reward ratio to below 1:1.
Rather than relying on occasional windfalls, I rely on:
Win rate + High frequency.
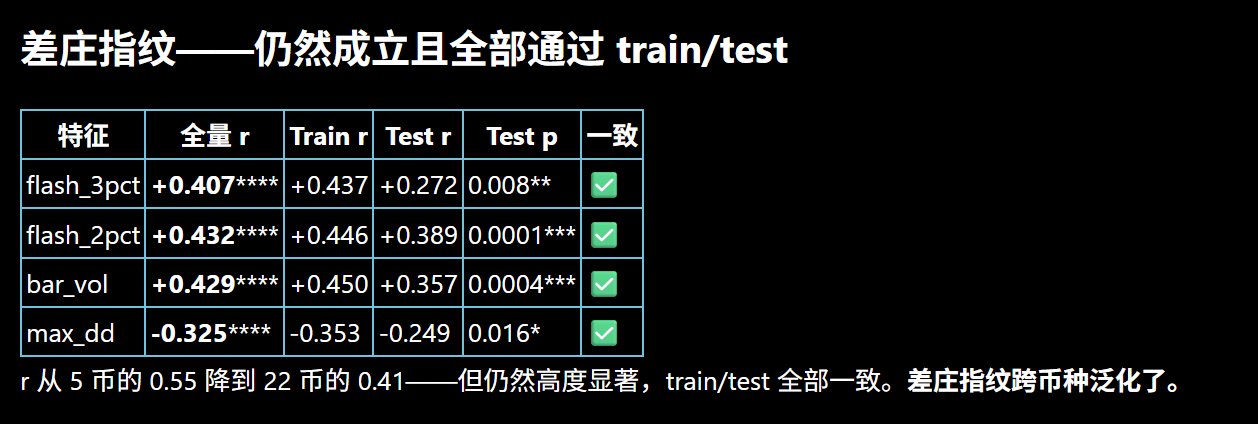
After incorporating new slippage, funding rates, and retesting with the latest dataset, I found:
The previous concern about Order Book depth turned out to be unfounded.
But I also confirmed another thing:
The manipulation range itself happens to be the most liquid area of trading volume.
Ultimately, out of the two strategies, only V4A held up.
The reason is straightforward:
For meme coins, the importance of early entry far outweighs "confirmation being very stable".
Eleven: Real-time Testing
To ensure that the entire study does not remain in the realm of "backtesting guru, live trading ghost," I did two more things:
· Set up a Scanner script to scan the necessary data for the strategy using the Binance API
· Deployed it on a VPS, scanning every 60 seconds
I also created a dashboard to push signals directly to a Discord Bot via a WebHook. Although real-time testing has not been running for long, the sample size is still small, and the confidence interval is very wide. Strictly speaking, it can only serve as directional guidance.
However, the overall results are in line with the research phase.
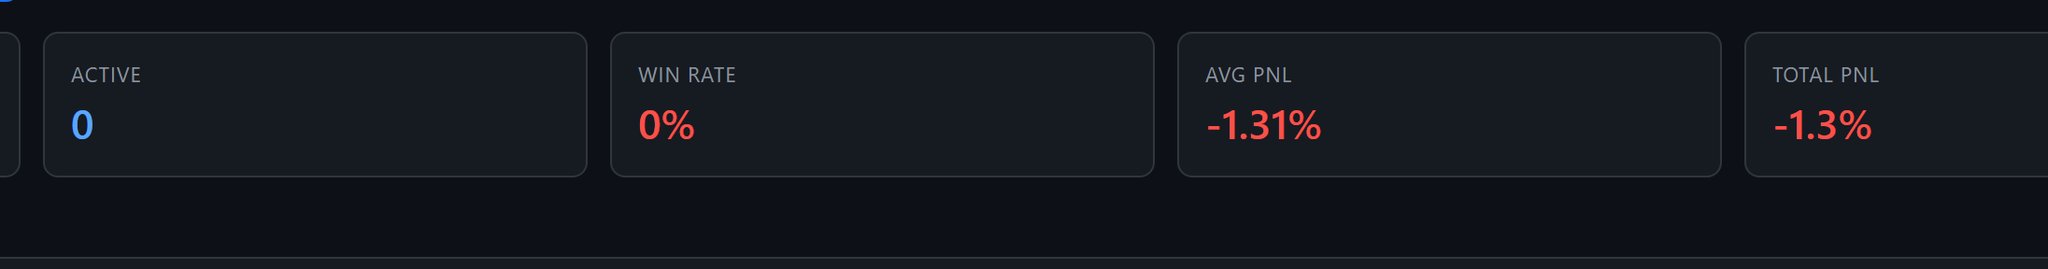
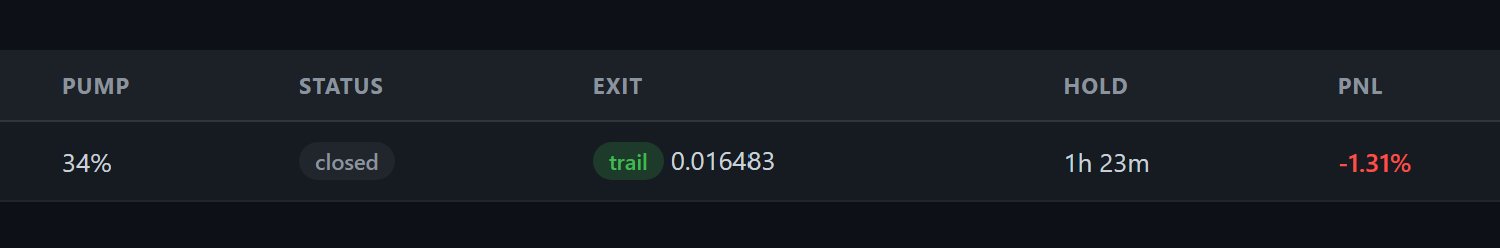
Currently, it is roughly as follows:
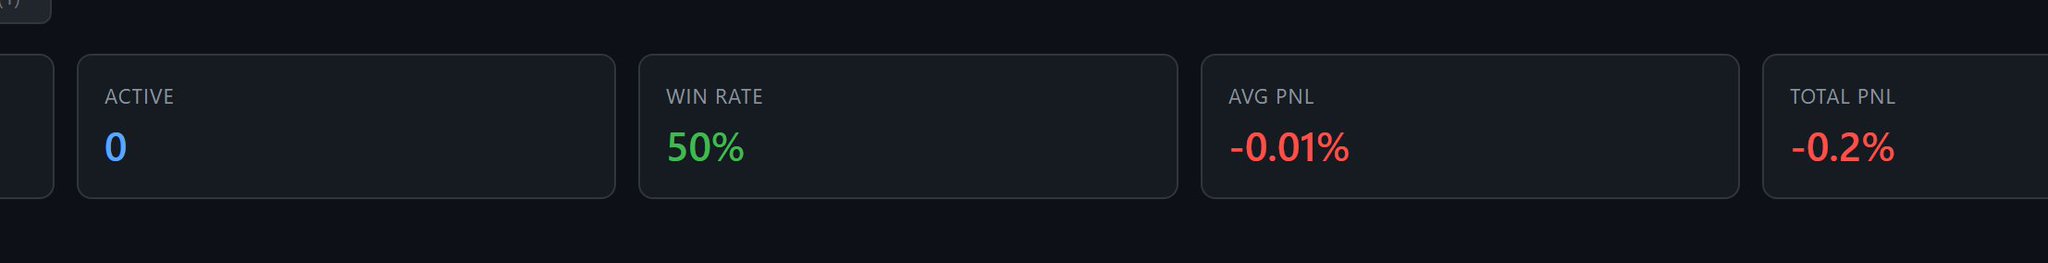
· V3: Most frequent triggers (about 70%), win rate 50%, but slightly negative PNL
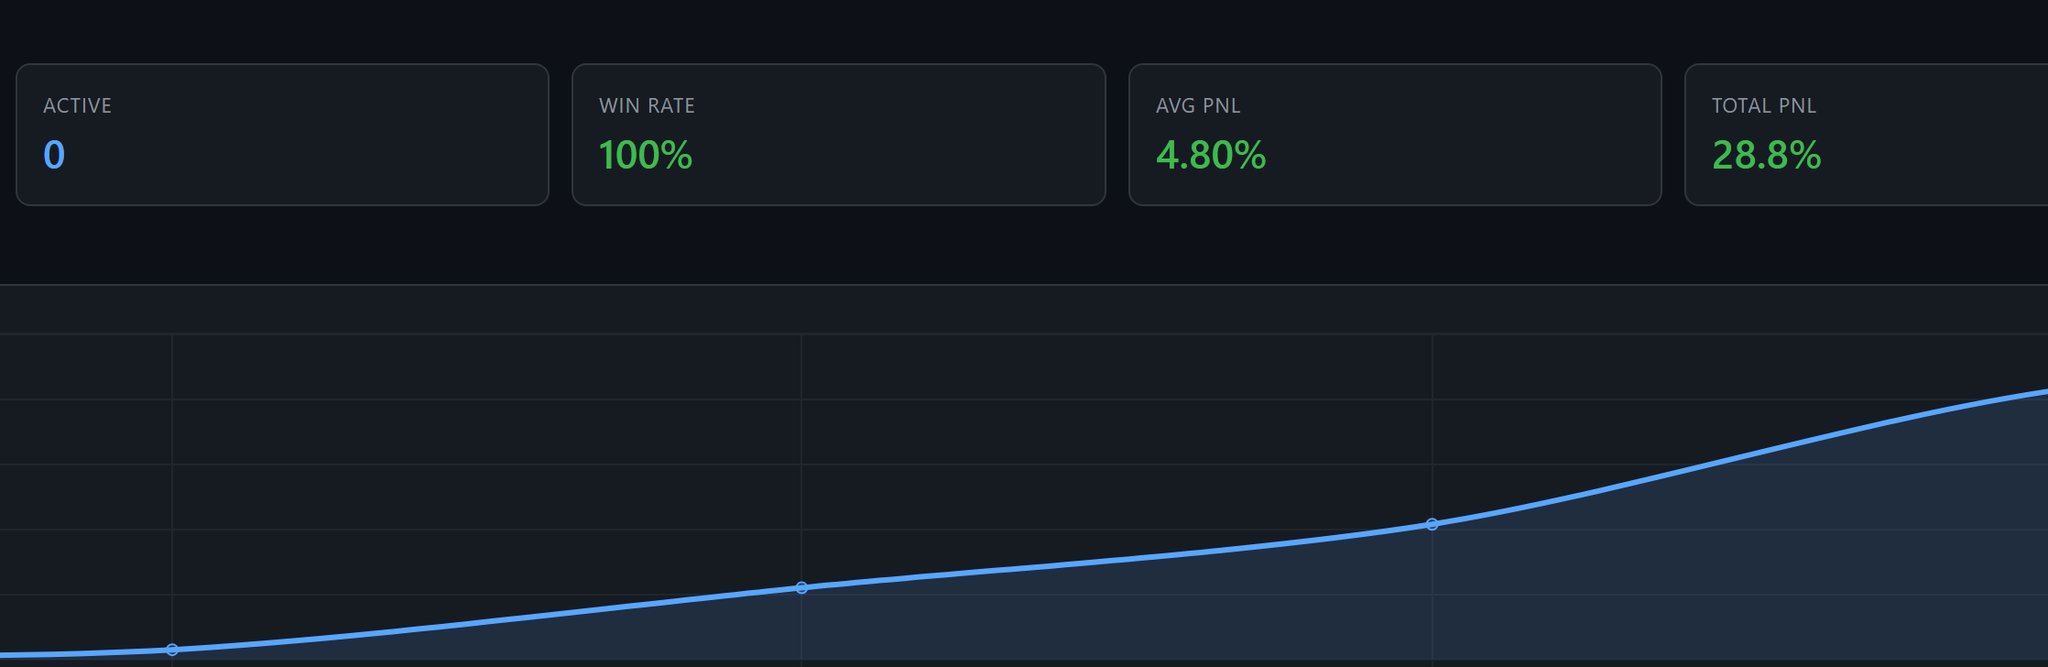
· V4A: Moderately frequent triggers (about 26%), current win rate 100%, PNL about 25%
· V4B: Triggered only once, resulting in a loss, and simultaneously set up a Dashboard to connect the signals to a Discord bot via WebHook
Although the live test has only been a few days, the results are basically consistent with the research
V3: Most frequent triggers (70% of the time), win rate 50%, but slightly negative PNL
V4A: Moderately frequent triggers (26% of the time), current win rate 100%, PNL around 25%, of course, the sample size is too small to draw conclusions, testing will continue
V4B: Triggered only once and incurred a loss
12. So far, I have summarized several key profit points
1. The position must be short
The median holding time for V4A is only 1 hour
2. Entry must be early, don't wait for over-confirmation
Waiting for confirmation often means missing out on the juiciest part
3. Exit must be decisive
As soon as signs of a reversal appear, run
4. Preserve Capital First, Then Pursue Profits
Do Not Turn meme Coins into Value Investments
5. Meme Coins Will Not Stop, Opportunities Are Abundant
With 70 monitoring groups, at least 2–3 V4A signals can be identified in a day
Subsequent Optimization
Currently, I am still conducting real-time testing, but there are several optimization directions worth considering:
1) Support and Resistance Signals, Possibly Related to Liquidation Heatmap
Intuitively, I believe
Better top and bottom signals are likely directly related to the liquidation heatmap.
Unfortunately, I do not yet have good enough data.
The principle is also simple:
· If there are no more short positions above
The market maker no longer has the incentive to continue pushing the price up and capturing funding rates
· The same applies below
So, I have started to collect data on the overall pool, bringing in all new contract coins introduced after March 2025, preparing for dedicated liquidation heatmap testing.
2) Market Manipulation Frequency Scoring System, Still a Bit Impromptu
Currently, I use the frequency of manipulation cycles over a period of time to score coins, distinguishing between "extremely high manipulation" and "high manipulation."
However, this system has a clear issue:
It is based on the frequency of the past 6 months.
Yet, in real trading, what we want is not "who was the most meme in the past,"
but "who is still worth memeing now."
Many coins that were frequently traded in the past
may have already entered the late stage of whale manipulation or even been abandoned.
Continuing to focus on them is not very meaningful.
Moreover, this "scoring" is also our human-defined
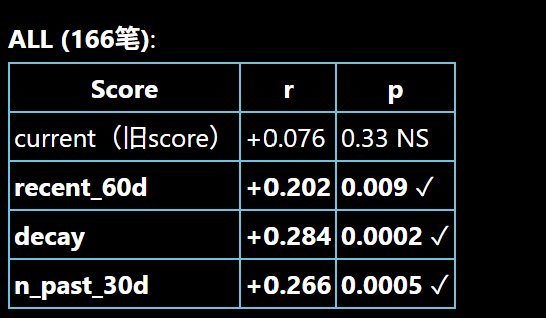
So the more reasonable direction would be to create a:
Dynamic Scoring System with Time Decay.
The preliminary data already supports this direction, now we just need more real-time test samples.
3) The range should be expanded to include old coins
Currently, my coin selection range mainly focuses on new contract coins after 2025.
However, in reality, many old coins are more suitable for trading:
· They have contracts, and some even have spot assets
· Their market cap is low enough
· The project has basically ended
· No one is paying attention to them
· All unlocks have been completed
In a sense, these coins are a natural trading blueprint.
If V4A is equally effective for these whale coins in the old coins, it means that this system is not just overfitting to new coin samples but truly captures a more universal trading mechanism.
Currently, the data tentatively supports this direction.
However, I am not yet ready to modify V4A's coin selection pool.
Thirteen, "How come those of you in the trading platform business are researching this?"
Following our philosophy at @Hertzflow_xyz, the trading opportunity for any asset is fundamentally just a game of ups and downs. Whether it's traditional assets, mainstream coins, or even "Ponzi schemes," the key is not the asset itself but the price movement patterns. As long as there is a pattern, a strategy can be implemented.
Meme coins are no exception
A trading platform is not just a place to list assets but a place to implement strategies. Instead of researching the fundamentals of assets, what we need to do more is study "what strategies can be applied to this trading pair, and are there any trading opportunities."
If there are opportunities, we should provide them to traders.
With AI in hand, you also have the opportunity to compete with whale traders. We will also normalize such data services and provide public services in the future in the form of @goo_economy skills.
@Hertzflow_xyz Testnet launched today with 17 "Ultra-High/High Manipulatability Score" assets, all of which are strategies we have tested and are currently tracking. From here, find your "Whale Hunting Strategy". These 17 assets are:
$0G
$AKT
$ARC
$F
$H
$HEMI
$HYPER
$MMT
$MOODENG
$PARTI
$PROMPT
$SOON
$STBL
$SWARMS
$TAC
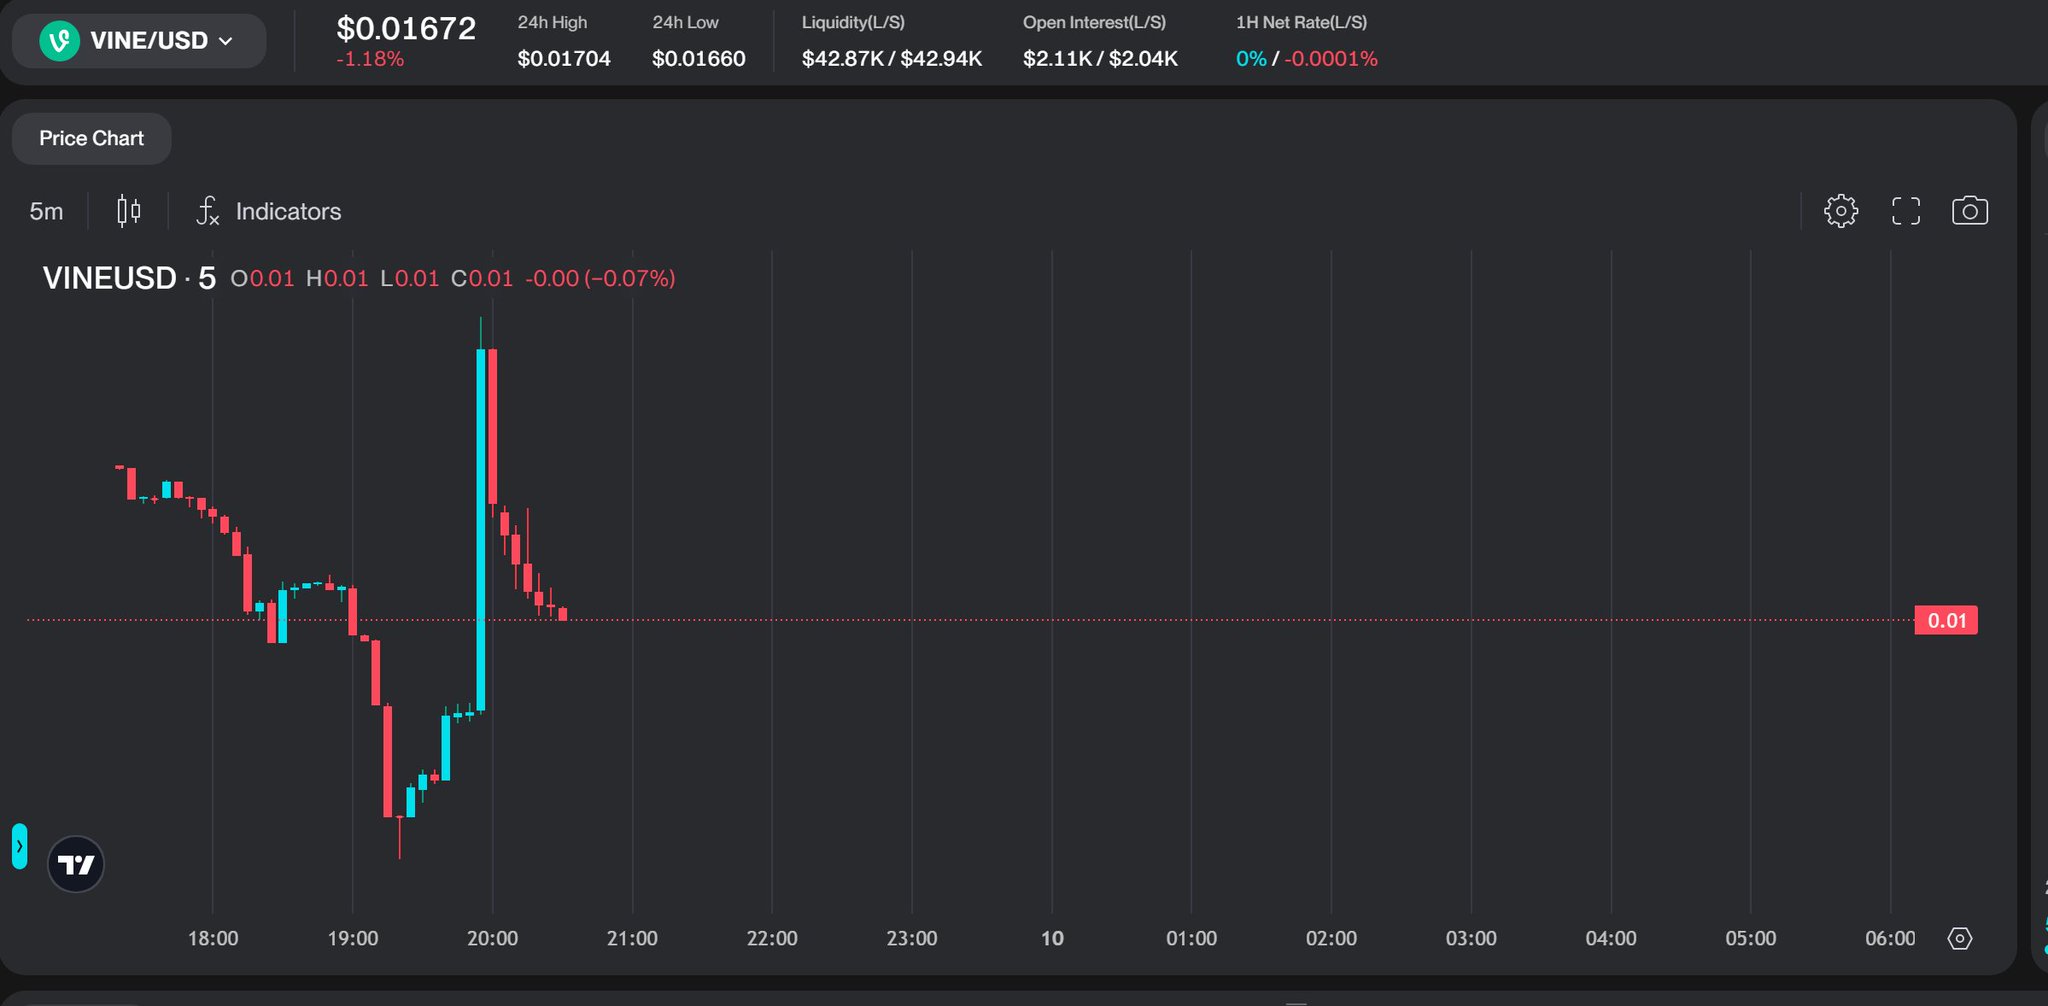
$VINE
$ZEREBRO
If you are not yet confident enough to trade with real money, then the HertzFlow testnet is your stepping stone
Can there be a man of noble rank without some kind of breeding! You too can be the "Whale" of tomorrow!