After getting the performance right, the real challenge is seeing clearly: which good news is already priced in, and which changes are worth repricing.
On the early morning of October 21 Beijing time, Netflix released its third-quarter earnings report, with earnings per share of $0.87. The OKX earnings prediction question settled as Yes, but from the U.S. stock market close before the earnings report to the close of the first full trading day after the earnings report, the corresponding perpetual contract fell by about 5.30%. Performance crossed the line, so why did the price still fall?
OKX's "Prophet Season 3" set up two types of predictions during earnings season: one question asked whether the company's earnings report reached a preset threshold, and the other asked whether the price rose on the first full trading day after the earnings report. Two questions that appear closely related may not necessarily give the same answer. How well the company earned this quarter and how much investors are willing to pay for it still need to be viewed separately.
Four companies, three combinations
The first-round results for Netflix, SpaceX, Tesla, and Meta are as follows:
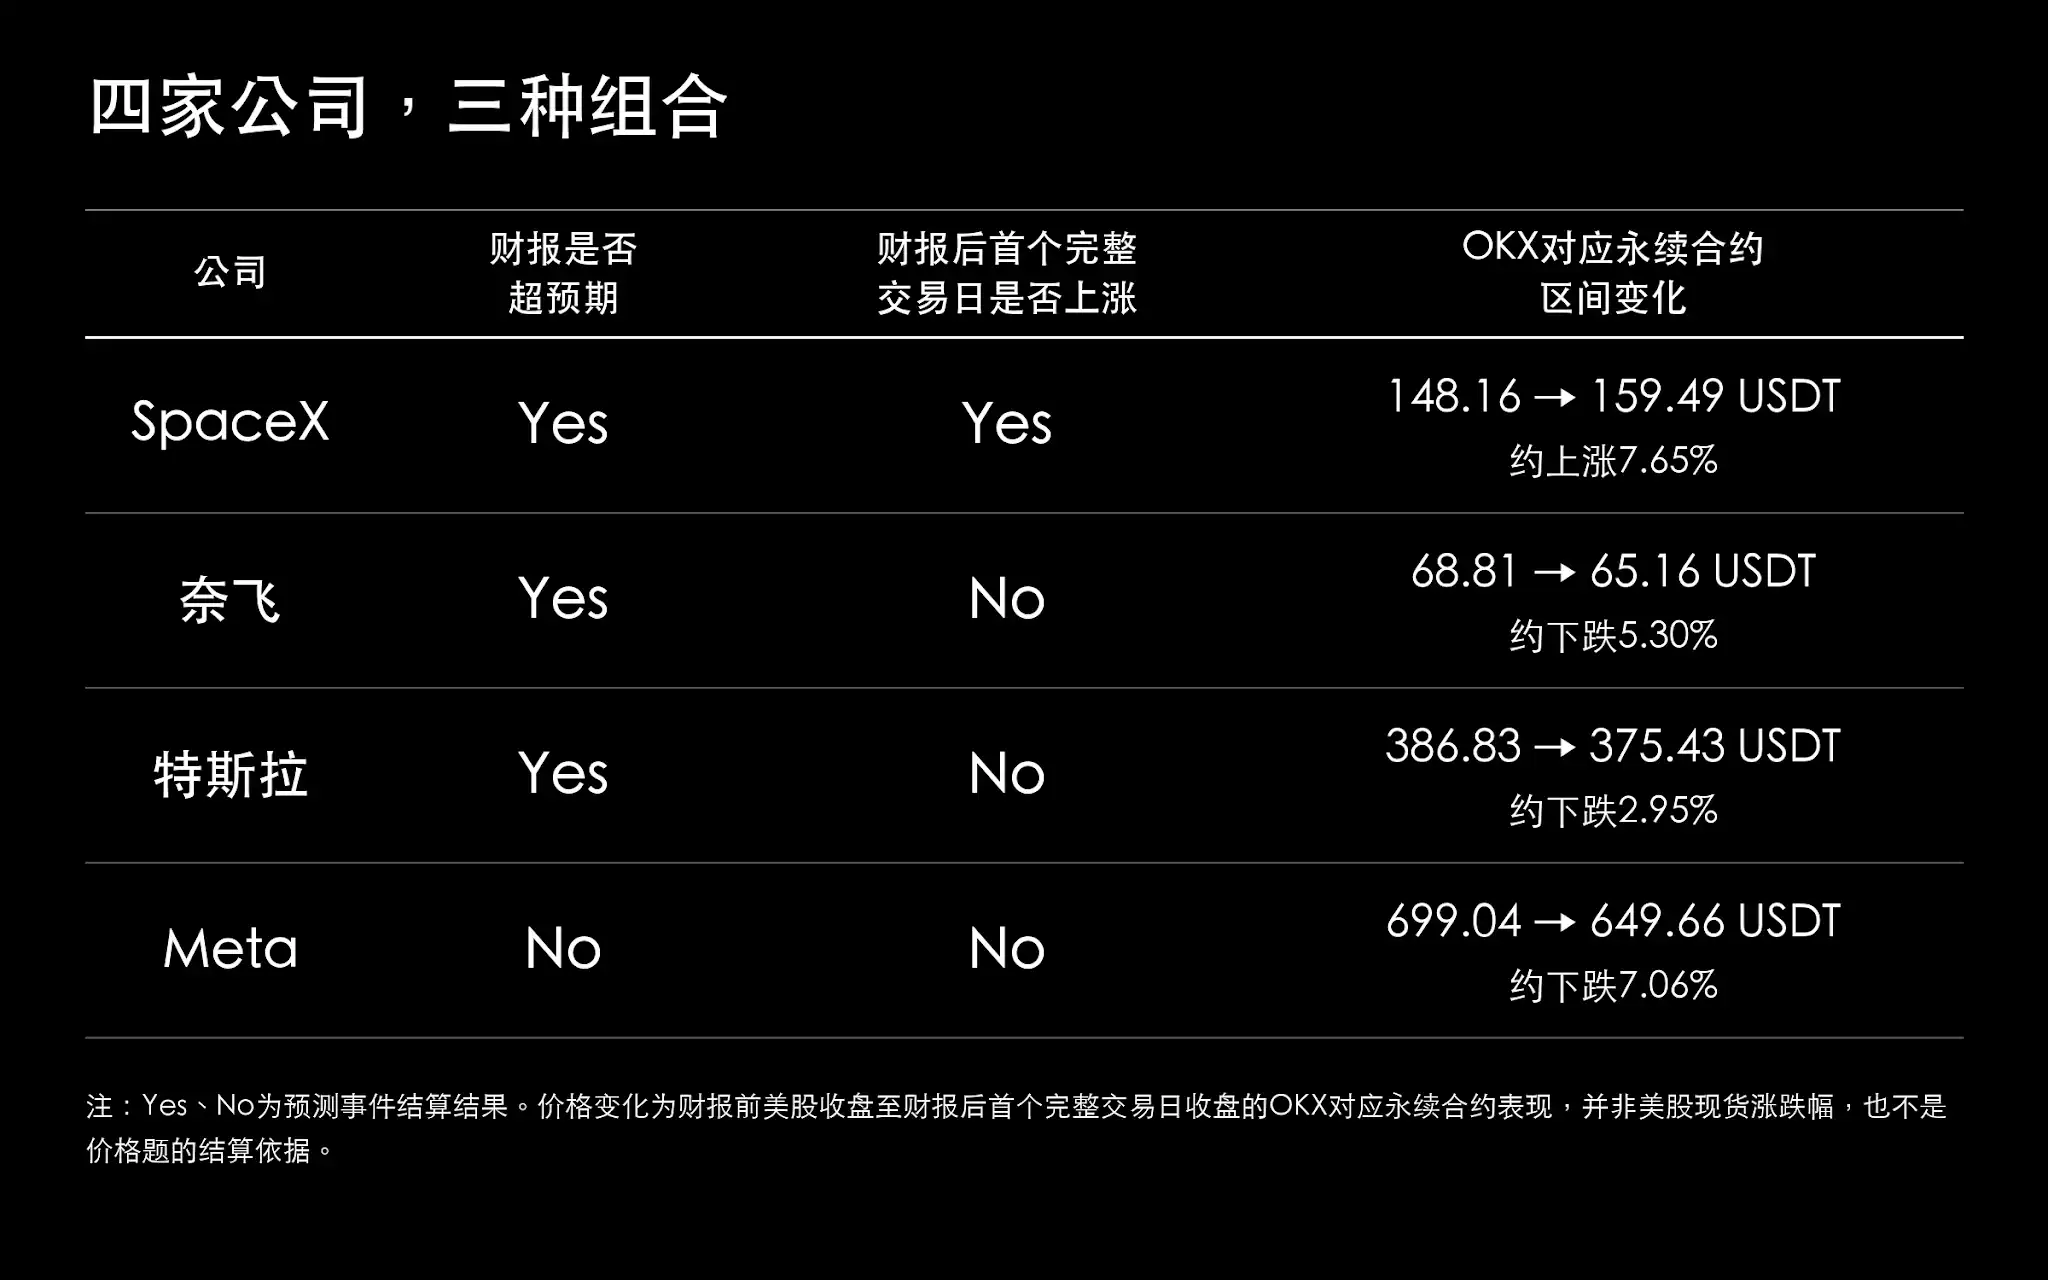
SpaceX's performance and contract price rose in the same direction. Quarterly revenue was $14.6 billion, up 161% year over year; net profit was $4.4 billion, compared with a loss of about $1.1 billion in the same period last year. However, how much revenue grew and how much the price rose are two different things, and the 161% revenue increase cannot be directly used to explain the 7.65% contract gain.
The earnings reports of the other three companies were not so easy to summarize as "good" or "bad." Netflix's earnings per share grew by about 49% year over year, but it lowered its full-year advertising revenue forecast from about $3 billion to about $2.7 billion; Tesla's quarterly revenue was about $28 billion, almost flat from the same period last year, while operating profit fell by about 56% year over year; Meta's revenue grew 26%, while also facing litigation costs and large-scale capital investment.
Earnings crossed the line, so why did the market still fall?
The "beat expectations" in the event settled according to the threshold set in advance by the question. The market's reaction to earnings also depends on what investors had expected beforehand: whether new businesses can continue to grow, whether profit margins can improve, and whether the company will raise future guidance. These expectations may not be fully captured by a single earnings-per-share question.
Two Netflix data points point to different time periods: EPS growth of about 49% refers to money already earned this quarter; the lowered advertising revenue forecast refers to a business that may be weaker than previously expected going forward. If investors bought in partly because they were bullish on advertising growth, meeting quarterly profit targets is not enough to dispel that concern. The earnings question can be settled as Yes, but investors still have reason to reassess the price.
Tesla's situation is that the threshold was crossed while operating profit declined at the same time. Investors also need to judge whether the profit decline will persist given that revenue has barely grown, and what kind of earnings performance current valuations require to be supported. For companies like this, clearing the question threshold is only part of earnings analysis.
This does not mean that post-earnings declines can all be attributed to "good news already priced in." You also need to look back at how much the stock rose before earnings, whether profit forecasts were raised, and whether valuations became more expensive. Sometimes price gains merely followed the whole sector. Management's explanations on the earnings call and concurrent market changes also affect trading. The advertising outlook and profit pullback provide analytical clues, but determining their impact on the decline requires more information.
Beyond profit, also look at investment and returns
Meta's earnings report has another point worth examining closely. Under US Generally Accepted Accounting Principles (GAAP), its earnings per share were $3.83; excluding litigation-related expenses, they were $7.40. The event settles according to the agreed GAAP basis, but when researching a company, one cannot stop at that answer alone; you also need to see how much of the profit change came from the core business, how much came from this expense, and how long the impact will last.
This expense creates a clear gap between the two EPS figures. The event can give one answer according to the rules, but investors need to look at both sides at once: earnings excluding the expense help in observing operating conditions; expenses recognized under GAAP did indeed affect shareholder returns. You cannot ignore it just because it is a special item, nor can you conclude solely from this expense that the core business will continue to deteriorate.
Meta's capital expenditure for the quarter was about $34.9 billion, free cash flow was negative $2.12 billion, raising another question: with revenue still growing, how much cash can the company retain? Free cash flow is usually calculated as operating cash flow minus capital expenditure, subject to the company's disclosed basis. Compared with EPS, it more directly reflects the cash situation after completing the relevant investments.
When buying equipment and building data centers, cash must be paid out first, while the related costs are usually depreciated gradually over the usage period. This explains why a company may still be profitable yet face cash flow pressure because of expansion. In Meta's earnings report, the profit basis and capital expenditure need to be viewed together; looking only at EPS makes it easy to miss the costs required for future growth.
For this investment, what the market is waiting for next is the return. If the new capacity is used by customers and can generate sufficient profit, today's spending could support future growth; if revenue fails to keep up and more capital has to be continually added, investors will need to reconsider the valuation. This question left by Meta's financial report will also carry over to the AI industry chain companies that follow.
How do forecasts help in reading the market?
Putting the two types of forecasts together can help observe whether participants' views on the financial report and the price are consistent. Forecast readings are formed by trading and reflect the inclination at the time; they do not equal the probability of the event actually occurring. User selection ratios and long-term accuracy rates also have their own statistical calibers. They can point out research directions but cannot directly prove whether the stock price is expensive or cheap.
If the financial report question clearly leans Yes but the price question is not so optimistic, what is worth paying attention to is this divergence: do participants believe the profit threshold is easy to reach but are more worried about subsequent guidance or investment? Has the previous rise already reflected the good news? When both questions lean Yes, then one should see how much room the actual financial report still has to exceed existing expectations. When both questions lean No, one should also consider whether the previous decline has already digested part of the concerns.
When looking at changes in readings, one must also remember when they occurred. One day before the financial report, one hour before the announcement, and during the conference call, participants know different information. If the financial report question has been leaning Yes while the price question gradually weakens, one can continue to investigate what new information appeared during that period. Views formed only after the financial report is published cannot be counted as forecasts made before publication.
Record these changes together with the reasons beforehand, so that after publication there is specific content to check against. If the financial report question is wrong, one can check operating estimates and accounting calibers; if the financial report question is right but the price question is wrong, one can check whether the market's reaction to good news was overestimated or whether guidance changes were missed. Even if the direction is correct, one must distinguish whether the company's performance met expectations or the price just happened to rise with the sector. Only by reviewing in this way can one avoid looking only for highlights after a rise and only for problems after a fall.
If the analysis is used for real trading, one must also separately consider the entry price, how much may be gained and lost, as well as costs and leverage. A higher probability of rising may still mean only a small gain; once it falls, the loss may be greater. Therefore, after getting the direction right, position sizing and exit conditions still need to be arranged.
The winning-streak test of "Financial Report Big Winner"
The OKX "Financial Report Big Winner" event linked financial report questions and price questions into a continuous challenge. In the first period, more than 700 contestants participated. Among the first round's 150 two-win contestants, in the end only 3 reached six consecutive wins. The three stopped in the same round and split the 10,000 USDT reward. The list shortened round by round, giving the event the suspense of a spectator sport, but this set of winning-streak results is still not enough to show how accurate the prediction market is over the long term.
The second phase gave participants a revival opportunity: according to the rules, by posting within the specified time with position cards and views, they could apply for revival. However, if they got two or more questions wrong on the same day, or got another question wrong after revival, they could not continue to advance. Both earnings questions and price questions had to be completed; participants could not just pick the category they were more confident in.
In the second phase, Robinhood and SK Hynix both had "No" for their earnings questions, but their price questions differed. Robinhood's GAAP earnings per share was $0.51, which did not meet the requirement of "strictly above $0.56"; although adjusted earnings per share was $0.60, the event still settled according to the specified basis. Robinhood's price question was also "No," while SK Hynix's price question was "Yes." Neither passed the earnings question, but their prices moved in different directions.
Google's results also differed from many participants' choices. Before the earnings report, OKX Chinese disclosed that about 62% of users chose "beat expectations"; Alphabet ultimately reported GAAP earnings per share of $2.12, which did not meet the question's requirement of "strictly above $3.10." Google Cloud growth and whether the group's earnings per share crossed the threshold are two different things. In addition, the 62% here is the proportion of user choices, not a forecast price formed by trading, and it cannot be used to judge why each participant chose Yes.
The successive appearance of questions on different companies also made consecutive wins increasingly difficult. Streaming media required looking at advertising growth, trading platforms required looking at customer activity, and memory chips required looking at demand and prices; these operating details ultimately had to be mapped onto each question's specified basis. Participants needed to switch research priorities in a short time and then choose how the market would react after the earnings report.
According to the October 30 battle report, 3 advancing contestants in the second phase completed a "seven-in-a-row," but all revival opportunities had been used up. There are still 5 first-day post-earnings price movement predictions ahead, and the three are not yet final winners. Even if they had correctly judged the performance before, they still had to judge how the market would react next, and there was no longer any room for error.
What to watch in the upcoming earnings reports?
In the upcoming earnings reports, the AI supply chain is still worth looking at as a whole. The cloud businesses and capital expenditures of Microsoft, Alphabet, and Amazon can help in understanding upstream demand. For cloud platforms, buying equipment is an investment; for chip, memory, and optical communications suppliers, it may become orders. The return-on-investment question left by Meta can be further examined along this chain.
Cloud platforms need to see whether customer usage and revenue can keep up with investment, while suppliers need to see whether orders can be delivered on schedule and how much profit and cash are ultimately left. For chip and memory companies, revenue growth also needs to be broken down into whether they sold more, raised prices, or increased the share of high-value products. Optical communications, computing infrastructure, and energy companies, in turn, need to compare delivery progress with capital investment.
Spending money, taking orders, delivering goods, recognizing revenue, and receiving payment often do not fall in the same quarter. Only by connecting upstream and downstream data can one more easily see whether growth is sustainable, and also explain why, despite benefiting equally from AI, companies still differ in their financial reports and price performance.
Another group worth comparing is Coinbase, Circle, and Strategy. They involve trading, stablecoin business, and digital asset prices, respectively, and the impact of market activity differs for each. When reading financial reports, it is important to distinguish which growth comes from business expansion and which is merely driven by market prices at the time. Interest rates and risk appetite are the common backdrop, but for each company, one still needs to look at its own revenue and balance sheet.
Therefore, what is worth comparing in subsequent financial reports is not only which companies exceeded the earnings threshold, but also whether revenue growth brought profits and cash. If several data points move in different directions, continue to investigate where growth comes from, where costs increase, and then see whether they have changed previous valuations of the company.
Summary
From Netflix's "earnings beat, price decline" to the two combinations shown by Robinhood and SK Hynix, these cases repeatedly point to the same question: what the market trades is not a report card, but how the report card changes judgments about the future. Forecast events give one of those judgments a clear threshold; stock prices continue to absorb changes in growth guidance, valuation, cost of capital, and risk appetite. The two can move in the same direction or in opposite directions.
Therefore, the trading reference value of forecasts lies not in providing a direction that must be profitable, but in forcing participants to separately judge "how performance will be" and "how the market will react," and to check item by item after the results come out. As more companies follow and industries become more dispersed, this distinction becomes more important: first understand the question and the data, then identify the expectations already embedded in prices, and finally observe how new information changes the market. What can endure is not just a string of Yes or No, but a judgment method that can withstand scrutiny and also allow revision.
Welcome to join the official BlockBeats community:
Telegram Subscription Group: https://t.me/theblockbeats
Telegram Discussion Group: https://t.me/BlockBeats_App
Official Twitter Account: https://twitter.com/BlockBeatsAsia
