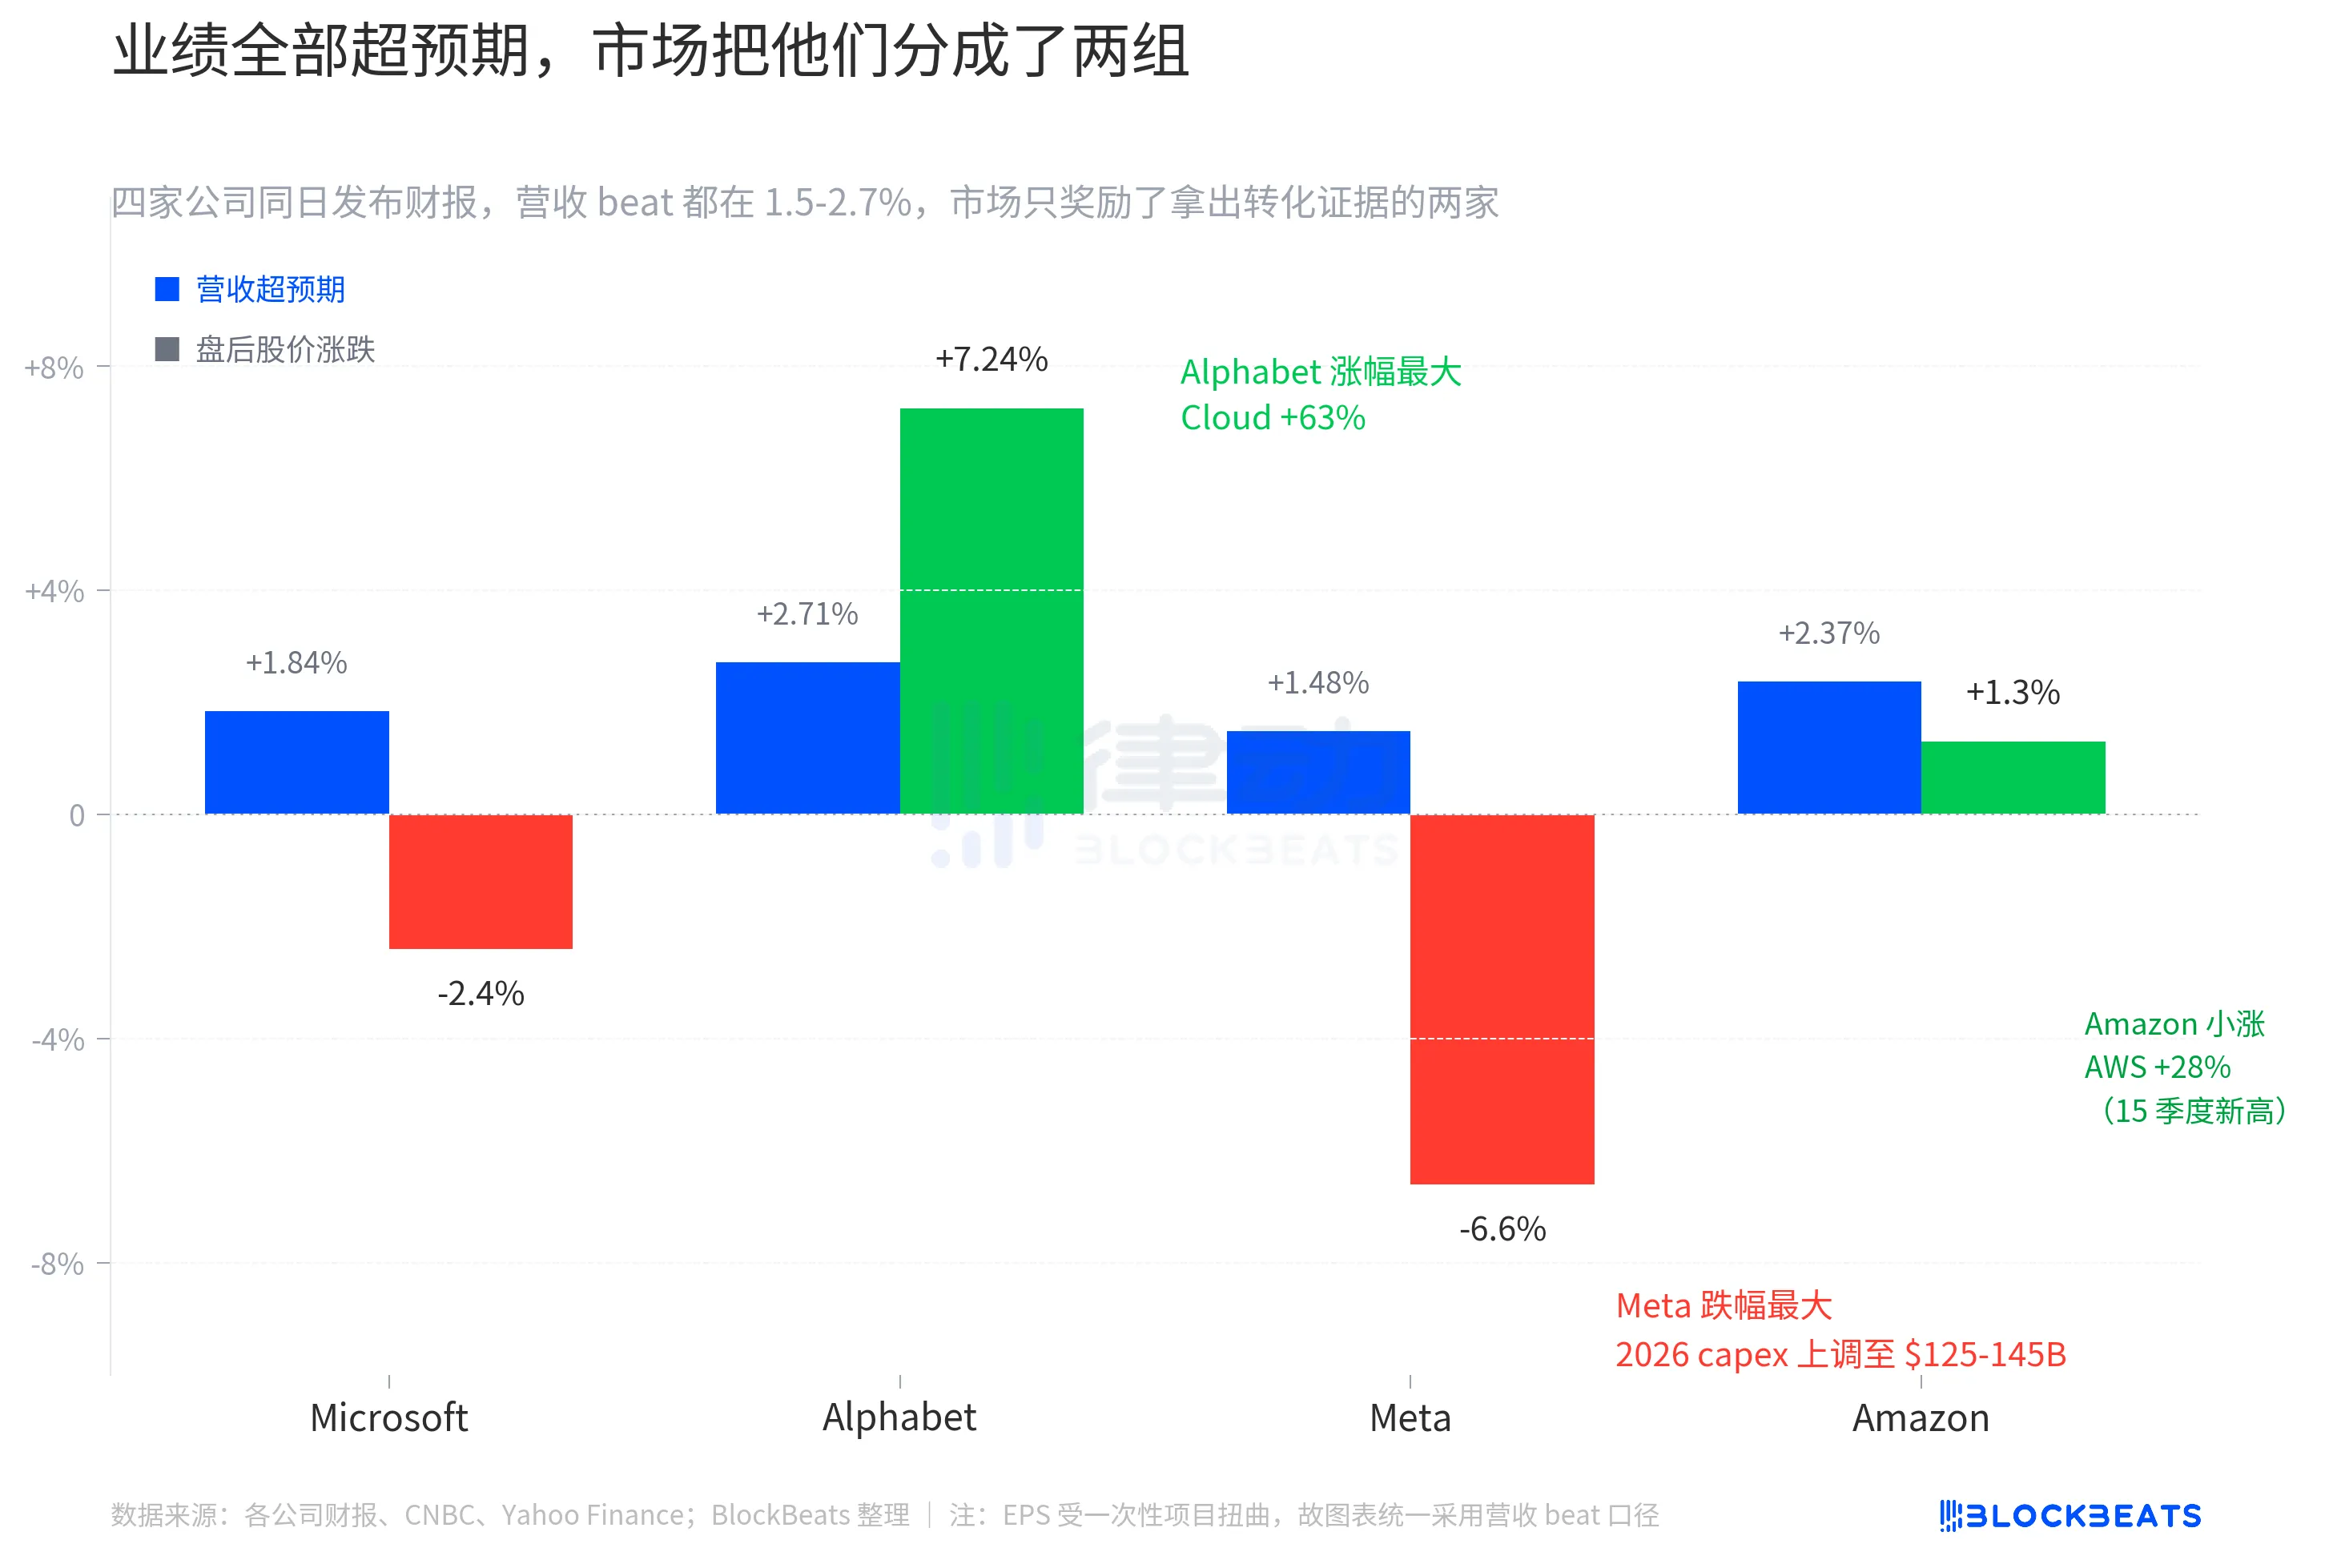
After the U.S. stock market opened last night, four U.S. tech giants, Microsoft, Google, Meta, and Amazon, simultaneously released their latest quarterly earnings reports. This was the first quarter of the Mag 7 to be reported almost on the same day, with the market initially prepared to receive four "better-than-expected" reports. Both revenue and EPS indeed exceeded analysts' expectations across the board. However, the market's reaction cleanly split them into two groups, with Google soaring by 7.24%, Amazon inching up by about 1.3%, and Microsoft and Meta plummeting by around 2.4% and 6.6%, respectively.
These four companies have a combined market capitalization of around $12 trillion, accounting for over a quarter of the S&P 500's weight. When four earnings reports were released on the same evening, the market should have been forced to make a judgment based on a common variable. The result did not point in a unified direction but instead showed a clear differentiation in a "conversion progress" pairwise manner.
The Era When "Beating Expectations" Is No Longer Valuable
The revenue beats of the four companies were concentrated between 1.5% and 2.7%. Google's revenue was $109.9 billion, beating expectations by 2.71%. Amazon reached $181.5 billion, surpassing by 2.37%. Microsoft reported $82.9 billion, exceeding by 1.84%. Meta achieved $56.3 billion, surpassing by 1.48%. These were not four "barely satisfactory" earnings reports but rather four uniformly impressive reports.
The EPS figures appeared even more exaggerated. Google's GAAP EPS was $5.11, beating expectations by 91%. Amazon's EPS was $2.78, topping by 70%. Meta's GAAP EPS was $10.44. Microsoft's adjusted EPS was $4.27, exceeding by about 5%. However, EPS figures cannot be directly compared. Google's numbers include a distortion of $36.9 billion in unrealized gains from equity, Meta includes an $8 billion one-time income tax offset, and Amazon's significant beat was mainly due to analysts' conservative estimates of AWS profit margin improvement. Therefore, this chart uniformly looks at the "beat magnitude" in revenue to allow the four companies to be measured on the same scale.
The strange thing lies on this scale. Amazon ranks second in beat magnitude but only saw a modest 1.3% increase after-hours. Google ranks third in beat magnitude, yet it experienced the largest post-market surge among the four companies at 7.24%. Meta had the smallest beat magnitude and suffered the greatest drop. There is no simple logic of "the bigger the beat, the higher the rise."
In other words, the market that night was not actually trading the quarterly performance but rather trading the two charts after the quarterly performance.
$710 billion Record Capex
2026 Capex Guidance, All Four Going Big.
Microsoft locked in its 2026 full-year capex at $190 billion during the earnings call. CFO Amy Hood explained on the call that around $25 billion of this was incremental costs due to high memory prices. Previously, Visible Alpha's consensus was only $154.6 billion. Overnight, Microsoft upped the market's spending expectations by $35.4 billion.
Meta raised its full-year capex range from $115-$135 billion to $125-$145 billion, shifting the range up by $10 billion overall. The CFO attributed the increase to "rising component prices" and "preparing for future-year capacity." The same earnings report also revealed a sequential decrease in DAU. Together, these two factors form a combination of "spending more aggressively now, but growth momentum is weakening."
Google adjusted its range from $175-$185 billion to $180-$190 billion, a modest $5 billion increase overall. Among the four, this was the most restrained increase. The CFO also hinted that capex in 2027 will continue to "significantly increase."
Amazon maintained the $200 billion guidance given in February. However, Q1 actual capex has already reached $44.2 billion, a 77% year-on-year increase. At this pace, it is highly likely to exceed the upper limit of the guidance for the full year. Meanwhile, TTM free cash flow has dropped from $25.9 billion last year to $1.2 billion, shrinking by 95%.
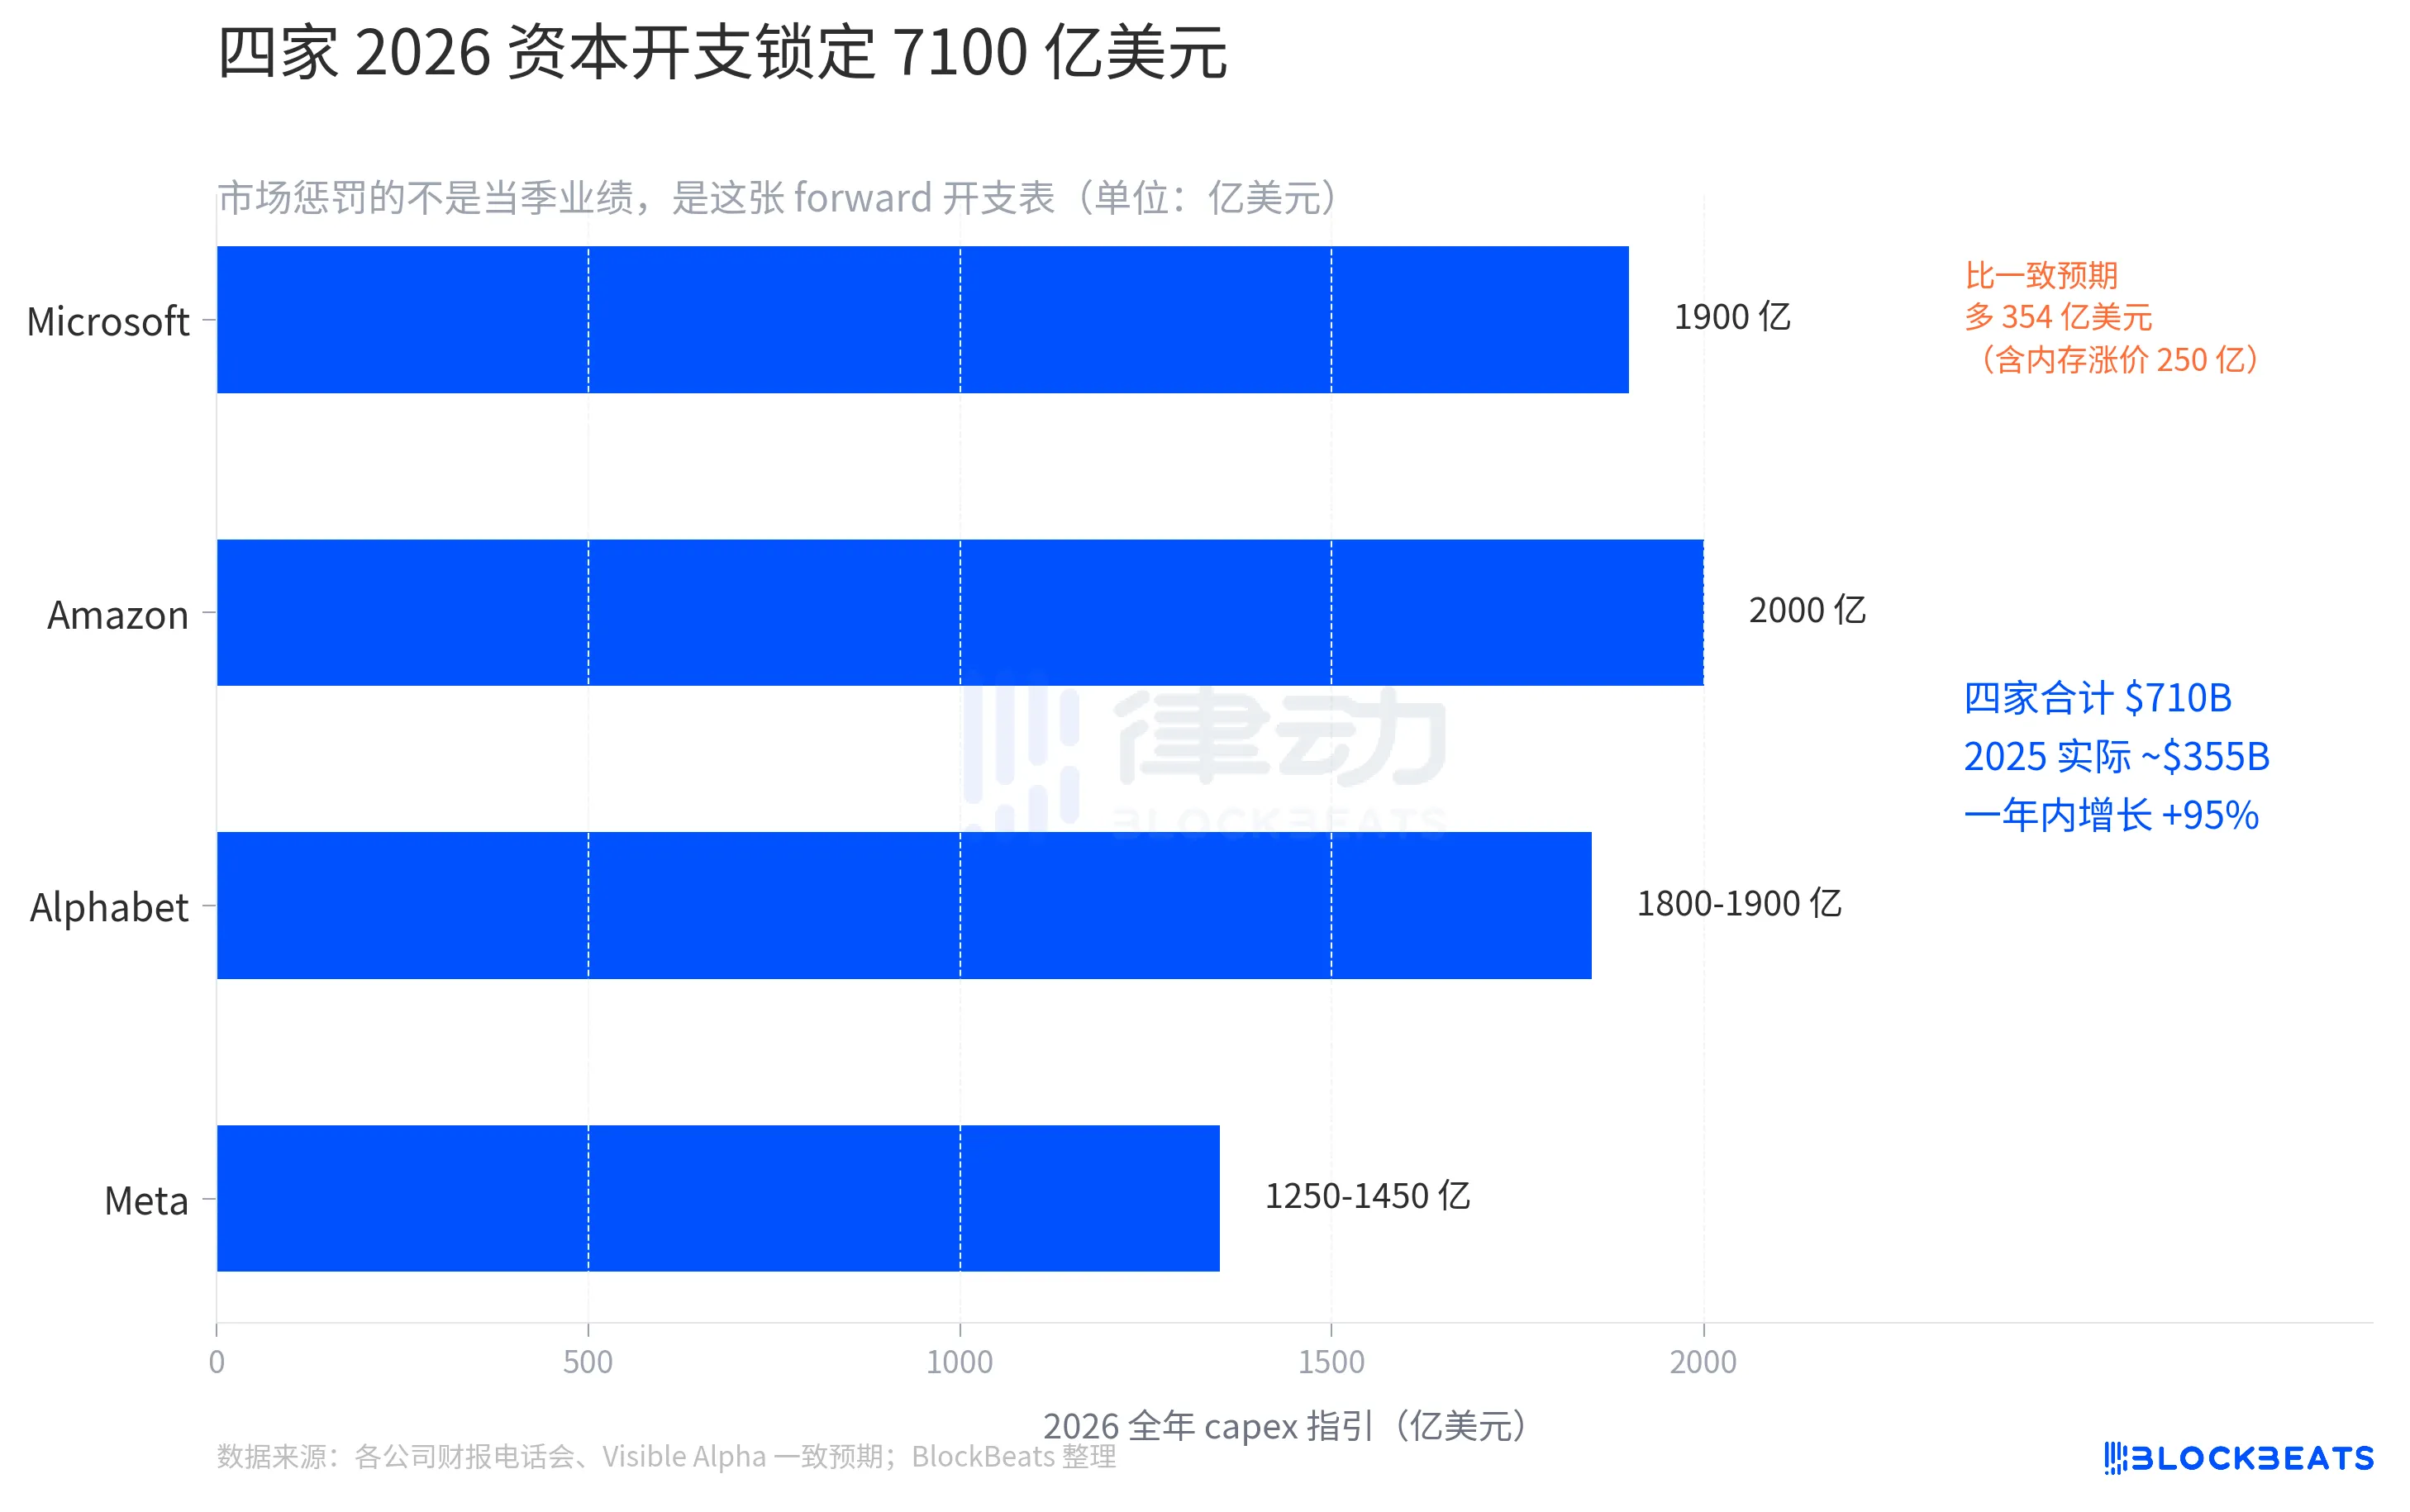
Adding up the midpoints of the 2026 capex guidance for the four companies amounts to $710 billion. $710 billion, even in their own histories, is exceptional.
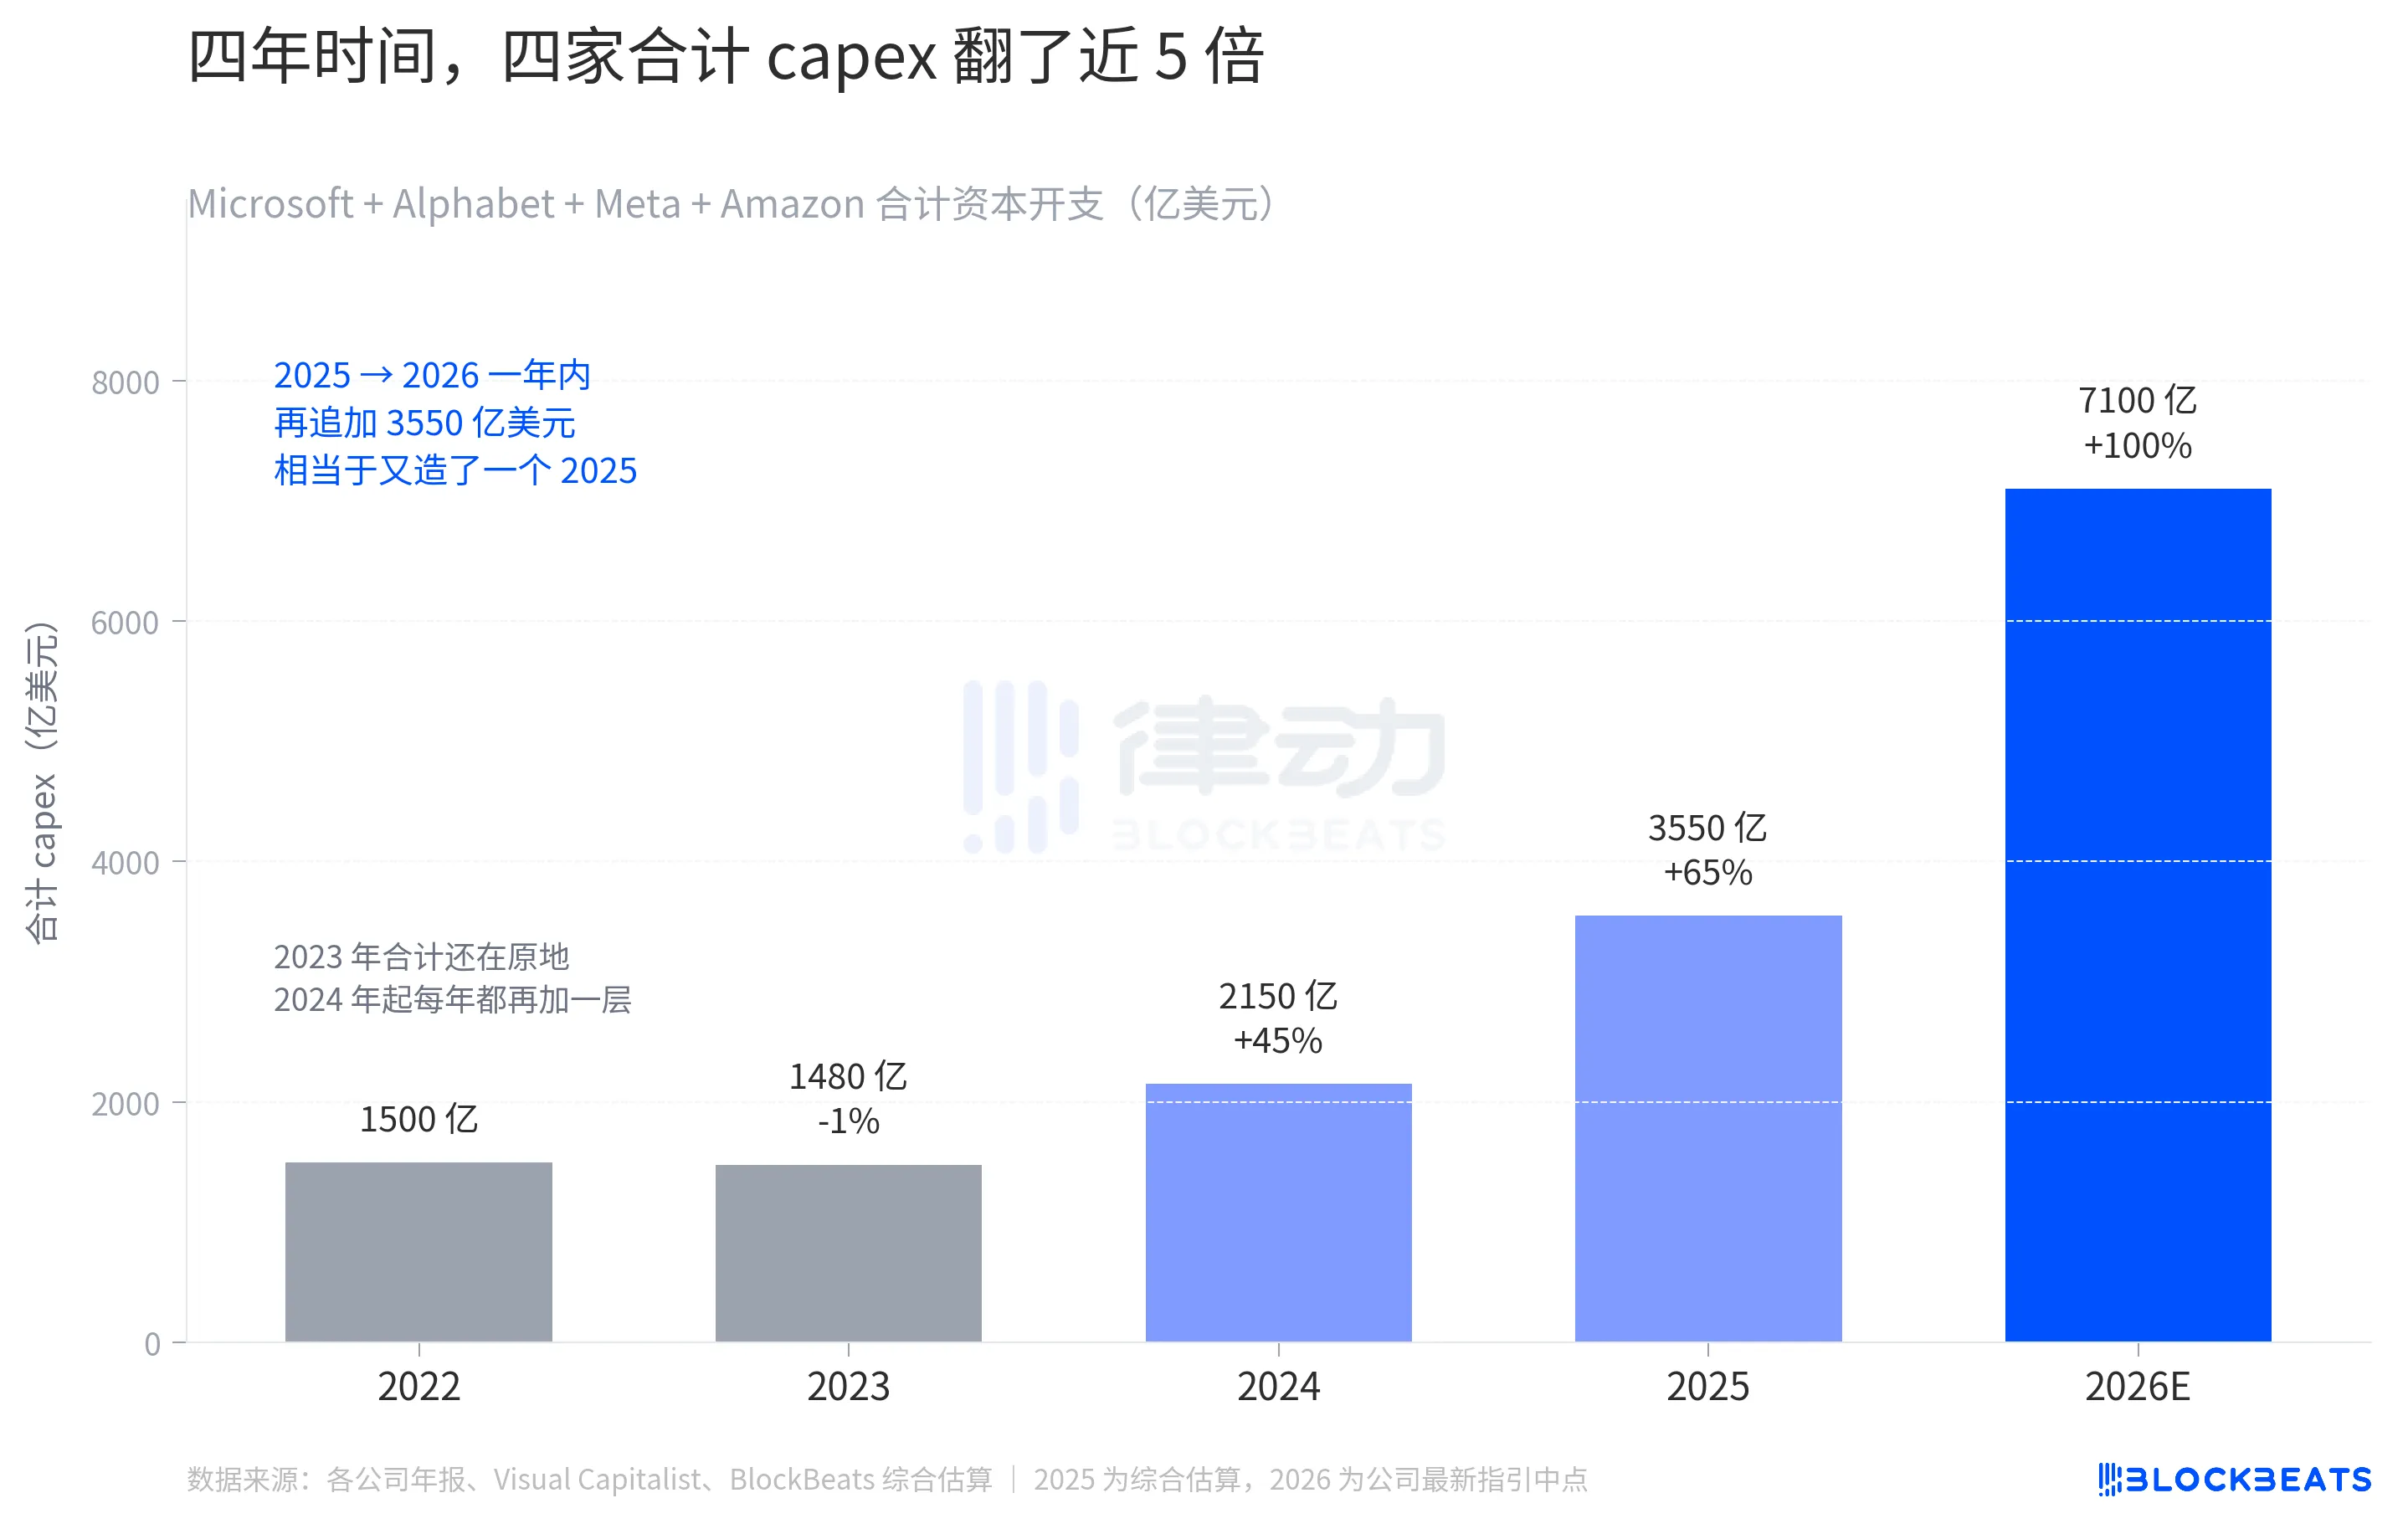
In 2022, the combined capex of these four companies was approximately $150 billion. In 2023, the total remained basically flat, and it wasn't until 2024 that it first jumped to $215 billion. Over the two years from 2022 to 2024, the four companies collectively spent an additional $65 billion. 2024 was the true turning point. Starting from that year, each subsequent year saw an additional layer built on the previous year. The estimate for 2025 was $355 billion, nearly doubling from the base in 2024. Then came the $710 billion in 2026.
This final span is more intense than any previous year. The year-over-year increase from 2025 to 2026 is $355 billion, equivalent to another full year of 2025 spending. In just four years, capex has shifted from "each company building several data centers in a year" to "four companies collectively building an entire country in a year."
This table is reshaping the entire industry's supply and demand. Microsoft's capex increase specifically noted $25 billion coming from the "high memory price impact," while Meta also mentioned component price hikes. The capex figure itself continues to grow, but a significant portion of it is actually being drained by the upstream compute chain. HBM, CoWoS packaging, electricity, land, transformers – each component is seeing a price hike. Spending the same $100 billion, in 2026, will result in less computing power compared to 2024.
The Rise of Two Giants: What Did They Get Right?
While all four are spending a similar capex amount, only Google and Amazon presented evidence this quarter that "the money is already starting to convert."
Google Cloud generated $20 billion in revenue this quarter, a 63% year-over-year growth rate. This is the first time Google Cloud has reached a scale comparable to AWS and Azure. Operating profit jumped from $2.2 billion in the same period last year to $6.6 billion, tripling in size. The hand unexecuted contract backlog nearly doubled to $460 billion sequentially. This means the visibility of future revenue has been significantly increased all at once.
Meanwhile, Gemini Enterprise's paid monthly active users (MAUs) increased by 40% sequentially, with the total number of paid subscriptions across the company reaching 350 million. The biggest bear case of the year, "AI is stealing search traffic," has been temporarily halted by this financial report.
Amazon, on the other hand, propelled AWS to a new high not seen in 15 quarters. AWS generated $37.6 billion in revenue this quarter, a 28% year-over-year growth, exceeding the market's expected 26%. AWS operating profit reached $14.2 billion, surpassing StreetAccount's consensus estimate by 10%. Concurrently, the advertising business brought in $17.2 billion, a 24% year-over-year growth, also exceeding market expectations. The acceleration of these two high-profit businesses is the key to the market's temporary tolerance of Amazon's $200 billion capex pace.
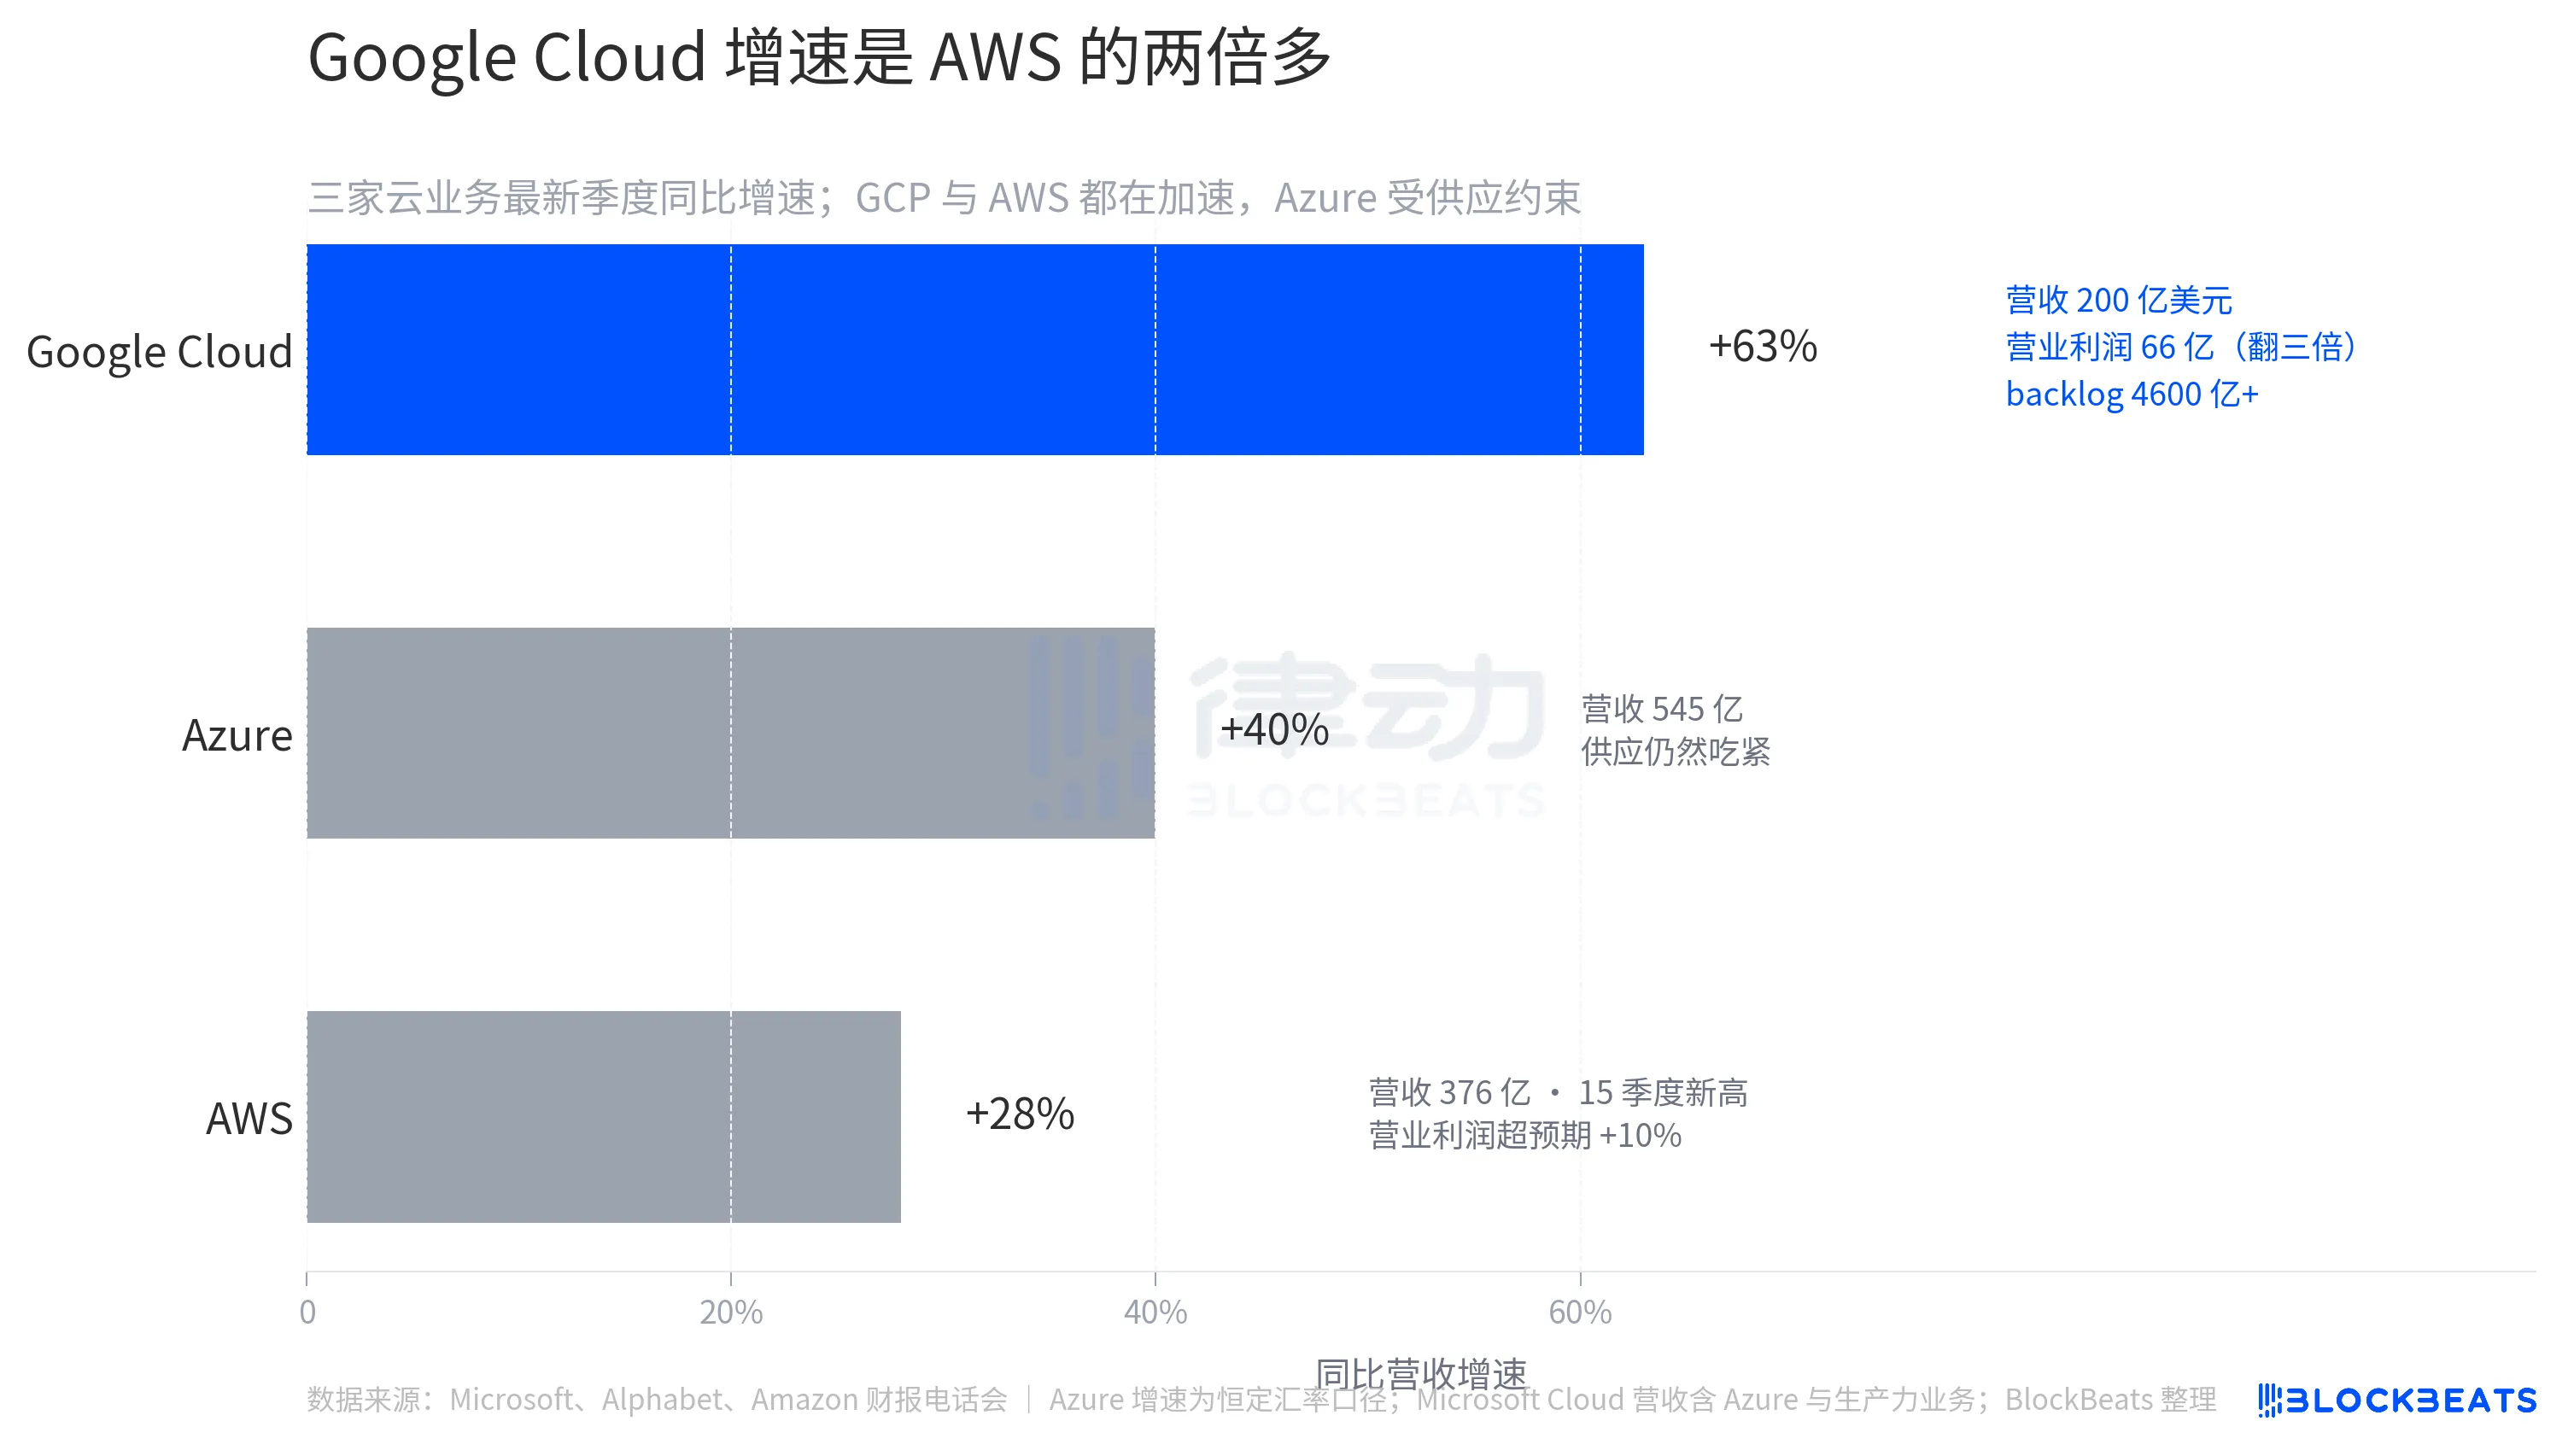
Comparing Microsoft and Meta. Microsoft Azure's growth rate is 39%-40% (constant currency basis), looking good on paper, but CFO Amy Hood has directly informed investors that Azure's computing power supply will remain tight at least until the end of FY 2026, which is after June 2026. Customer demand has consistently outpaced supply, with the bottleneck being GPU and data center construction speed. Microsoft will have to wait a few more quarters to convert capex into billable Azure revenue.
Meta's performance itself is impressive, but with an overall increase in capex range coupled with a decline in DAU compared to the previous period, the market sees a combination of "spending more money now, while user engagement is loosening." This is the worst market reaction among the four companies.
The quarterly reports released by the four companies on the same day made one thing clear, the ability to beat consensus expectations is now a given, and the market is starting to group the four companies based on "conversion progress." Those who can convert capex into revenue or profit in the same quarter are rewarded. Those who can only show larger expenditure sheets are punished.
Welcome to join the official BlockBeats community:
Telegram Subscription Group: https://t.me/theblockbeats
Telegram Discussion Group: https://t.me/BlockBeats_App
Official Twitter Account: https://twitter.com/BlockBeatsAsia