Low Float, Grand Narrative, High Market Cap are becoming common features of this round of financial market speculation.
Less freely tradable shares, a grand narrative, and a high market cap are becoming common features of this round of financial market speculation.
Less freely tradable shares, a grand narrative, and a high market cap are becoming common features of this round of financial market speculation.
Less freely tradable shares, a grand narrative, and a high market cap are becoming common features of this round of financial market speculation.
Less freely tradable shares, a grand narrative, and a high market cap are becoming common features of this round of financial market speculation.
Less freely tradable shares, a grand narrative, and a high market cap are becoming common features of this round of financial market speculation.
Less freely tradable shares, a grand narrative, and a high market cap are becoming common features of this round of financial market speculation.
Less freely tradable shares, a grand narrative, and a high market cap are becoming common features of this round of financial market speculation.
The Era of Financial Reporting-Based Pricing is Over
In February 2000, a sock-puppet dog appeared in a Super Bowl commercial. The ad was bought by Pets.com for $1.2 million. At that time, its annual revenue was less than $6 million, with losses exceeding $60 million. Nine months later, the company liquidated, and the sock-puppet became the epitome of the dot-com bubble.
The market lesson of that generation was almost written into all investment textbooks: valuation without revenue support is a bubble, and the narrative cannot replace financial reports.
Over the next twenty years, this lesson ruled the market. DCF, PE, PEG, Free Cash Flow Discounting—all valuation methods based on financial report data became mainstream. Buffett was deified again after the 2008 financial crisis. "Buying without looking at financial reports" became synonymous with speculation.
However, when we look at the new technology race from 2025 to 2026 today, we find a fact: the most hyped companies in these industries are actually losing money.
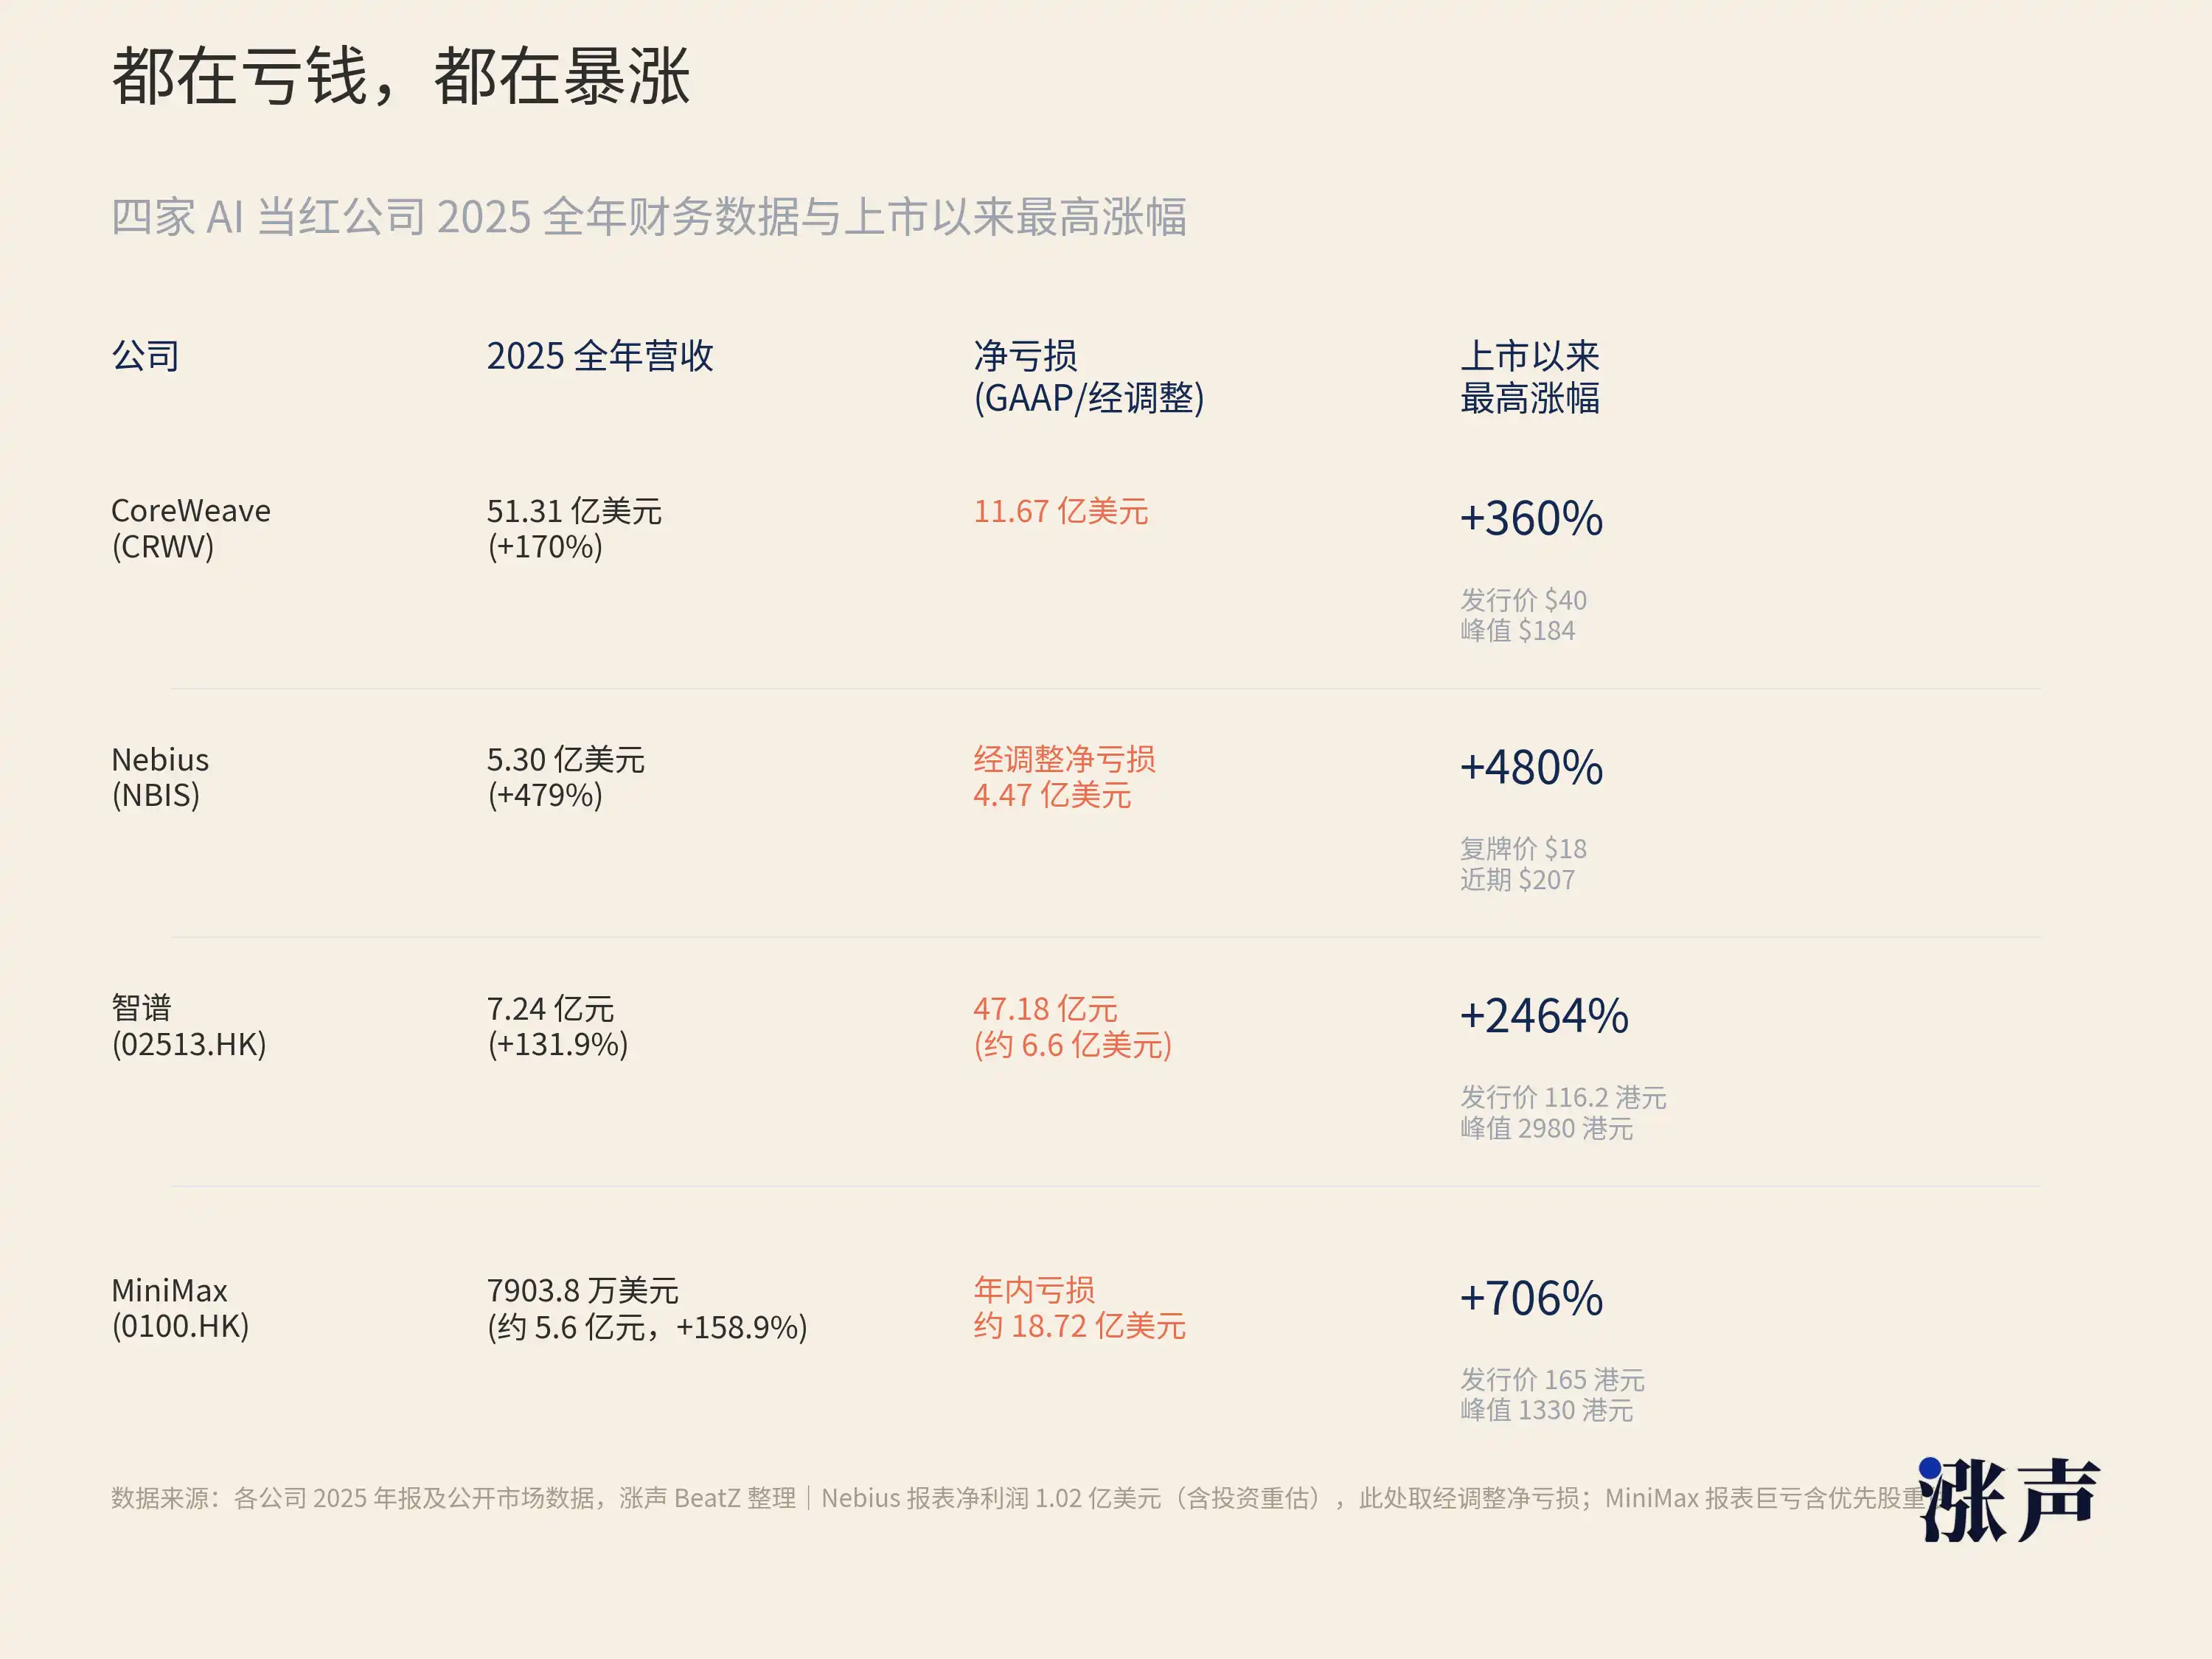
For example, CoreWeave, an NVIDIA-backed AI computing infrastructure company, had revenue of $16 million in 2022, $5.1 billion in 2025, a growth of over 300 times in three years. While the revenue growth rate is astonishing, the net loss also expanded from $31 million to $1.2 billion. In the first quarter of 2026, the company had a revenue of $2.1 billion and a net loss of $740 million, with a debt-to-equity ratio of 10.7. By traditional banking credit standards, such a balance sheet is not healthy. However, after going public, its stock price surged by 190% at one point.
A similar situation is seen with Nebius. This company, formerly part of Russia's Yandex, pivoted to AI cloud services. In the first quarter of 2026, it had revenue of $399 million, a 684% year-on-year increase, but still reported an adjusted net loss of $100 million. In the past 12 months, its stock price has risen by over 510%.
Shifting focus back to the Chinese market.
Zhipu, with full-year revenue of 724 million RMB in 2025, approximately $100 million, but a net loss of 3.182 billion RMB, 4.4 times its revenue. In other words, for every $1 it earns, it spends far more than $1 on computing power and R&D. Another AI stock listed in the same batch, MiniMax, saw its Hong Kong shares surge by 109% on the first day, with subsequent increases exceeding 700%. With full-year revenue of $79.038 million, about 560 million RMB, it is less than Zhipu.
Similarly, the Hong Kong GPU company Biren Technology, A-share domestic GPU Mu Xi Technology, Sci-Tech Innovation Board Moore Thread, saw first-day increases of 120%, 693%, and 425%, respectively. These astonishingly surging new stocks are also in a state of severe losses or no profitability.
When looking at these companies based on PE ratios, many do not even have a premise to calculate as their profits are negative. Looking at PS ratios, Zhipu is over 1,200 times, while SpaceX is around 95 times. Using DCF analysis, a slight change in discount rate and terminal growth rate could cause the conclusion to drop from $100 billion to $10 billion, rendering the model highly sensitive to the point of losing its guiding significance. Aswath Damodaran, the author of the DCF textbook, valued SpaceX at $1.2 trillion, 30% lower than the IPO price, acknowledging that even a slight adjustment in parameters when dealing with this generation of IPOs can lead to dramatic fluctuations in results.
Some may say that in the early days of the Internet, PE ratios were also ignored, and Amazon took twenty years to turn a profit, so this is nothing new. That's true, but there is a key difference between this cycle and the Internet era: the market is not even using PE or alternative metrics to price, but rather trading purely on narrative.
While investors in the Internet era did not focus on PE ratios, they looked at user growth, GMV, page views, essentially using a set of quantifiable intermediate metrics to anchor valuations. Today's AI companies have similar metrics like ARR, but even ARR cannot explain a P/S ratio of 1200x. The hype around supply chain has long detached from the gravity of financial fundamentals, pricing in all the expectations for the next three to five years into the present.
The old pricing frameworks are starting to fail in the face of a new type of asset. The world's financial markets and investors' logic have undergone huge changes.
Model weights, algorithm capabilities, developer ecosystems, and computing power scheduling are the true core assets of AI companies, yet none of these can be written into the balance sheet. The programming capabilities of GLM-5.2 led Vercel's CEO to say "almost shocked," a statement that will not be reflected in the income statement of Meta. CoreWeave sits on a backlog of $100 billion in orders, but this does not change the fact of its net loss for the quarter. Nvidia's GPUs are called the oil of the AI era, and the pricing of oil has never been based solely on quarterly production, but also on reserves, demand curves, and geopolitics.
The core assumption of traditional pricing methods is that future cash flows can be extrapolated from historical financial data. This assumption works very well in industries such as consumer goods, finance, and real estate.
But the revenue curve of AI companies is not extrapolated linearly. It depends on leaps in model capabilities, network effects of open ecosystems, sudden shifts in policy and industry cycles. After the release of GLM-5.2, Meta's narrative status could change overnight; Llama going open source rapidly amplifies Meta's AI influence; U.S. chip restrictions on China transform Wallen and Muxi from marginal companies into "domestic alternatives." These variables are difficult to incorporate into any financial model in advance.
At the same time, the market's tolerance for narrative dominance is rising, because over the past few years, those who believed in narratives did indeed make money.
Those who ignored financial statements and bought Nvidia at the beginning of 2023 saw their investment increase tenfold. Those who ignored financials and bought Meta at the beginning of 2026 saw a 24x return. When an "incorrect" approach consistently delivers "correct" results, the market will adjust its methodology rather than correcting the outcomes.
A Lot Less Money Holds Up High Market Caps Than You Might Think
A Nasdaq study looked back at data from 1980 to 2020: In the 1980s, the average free float of US stock IPOs was about 30% of total shares outstanding. By 2020, this number had dropped to around 20%.
J.P. Morgan provided a more macro figure in a report from June 2026: Newly issued shares in IPOs, combined with early investor shares allowed to be sold after lock-up expiry, only represent approximately 1% of the total market capitalization.
The free float of IPOs has been shrinking. This has been an almost thirty-year trend.
Nasdaq also found a clear inverse relationship between free float and first-day returns. In years with a smaller free float, the first-day returns were larger.
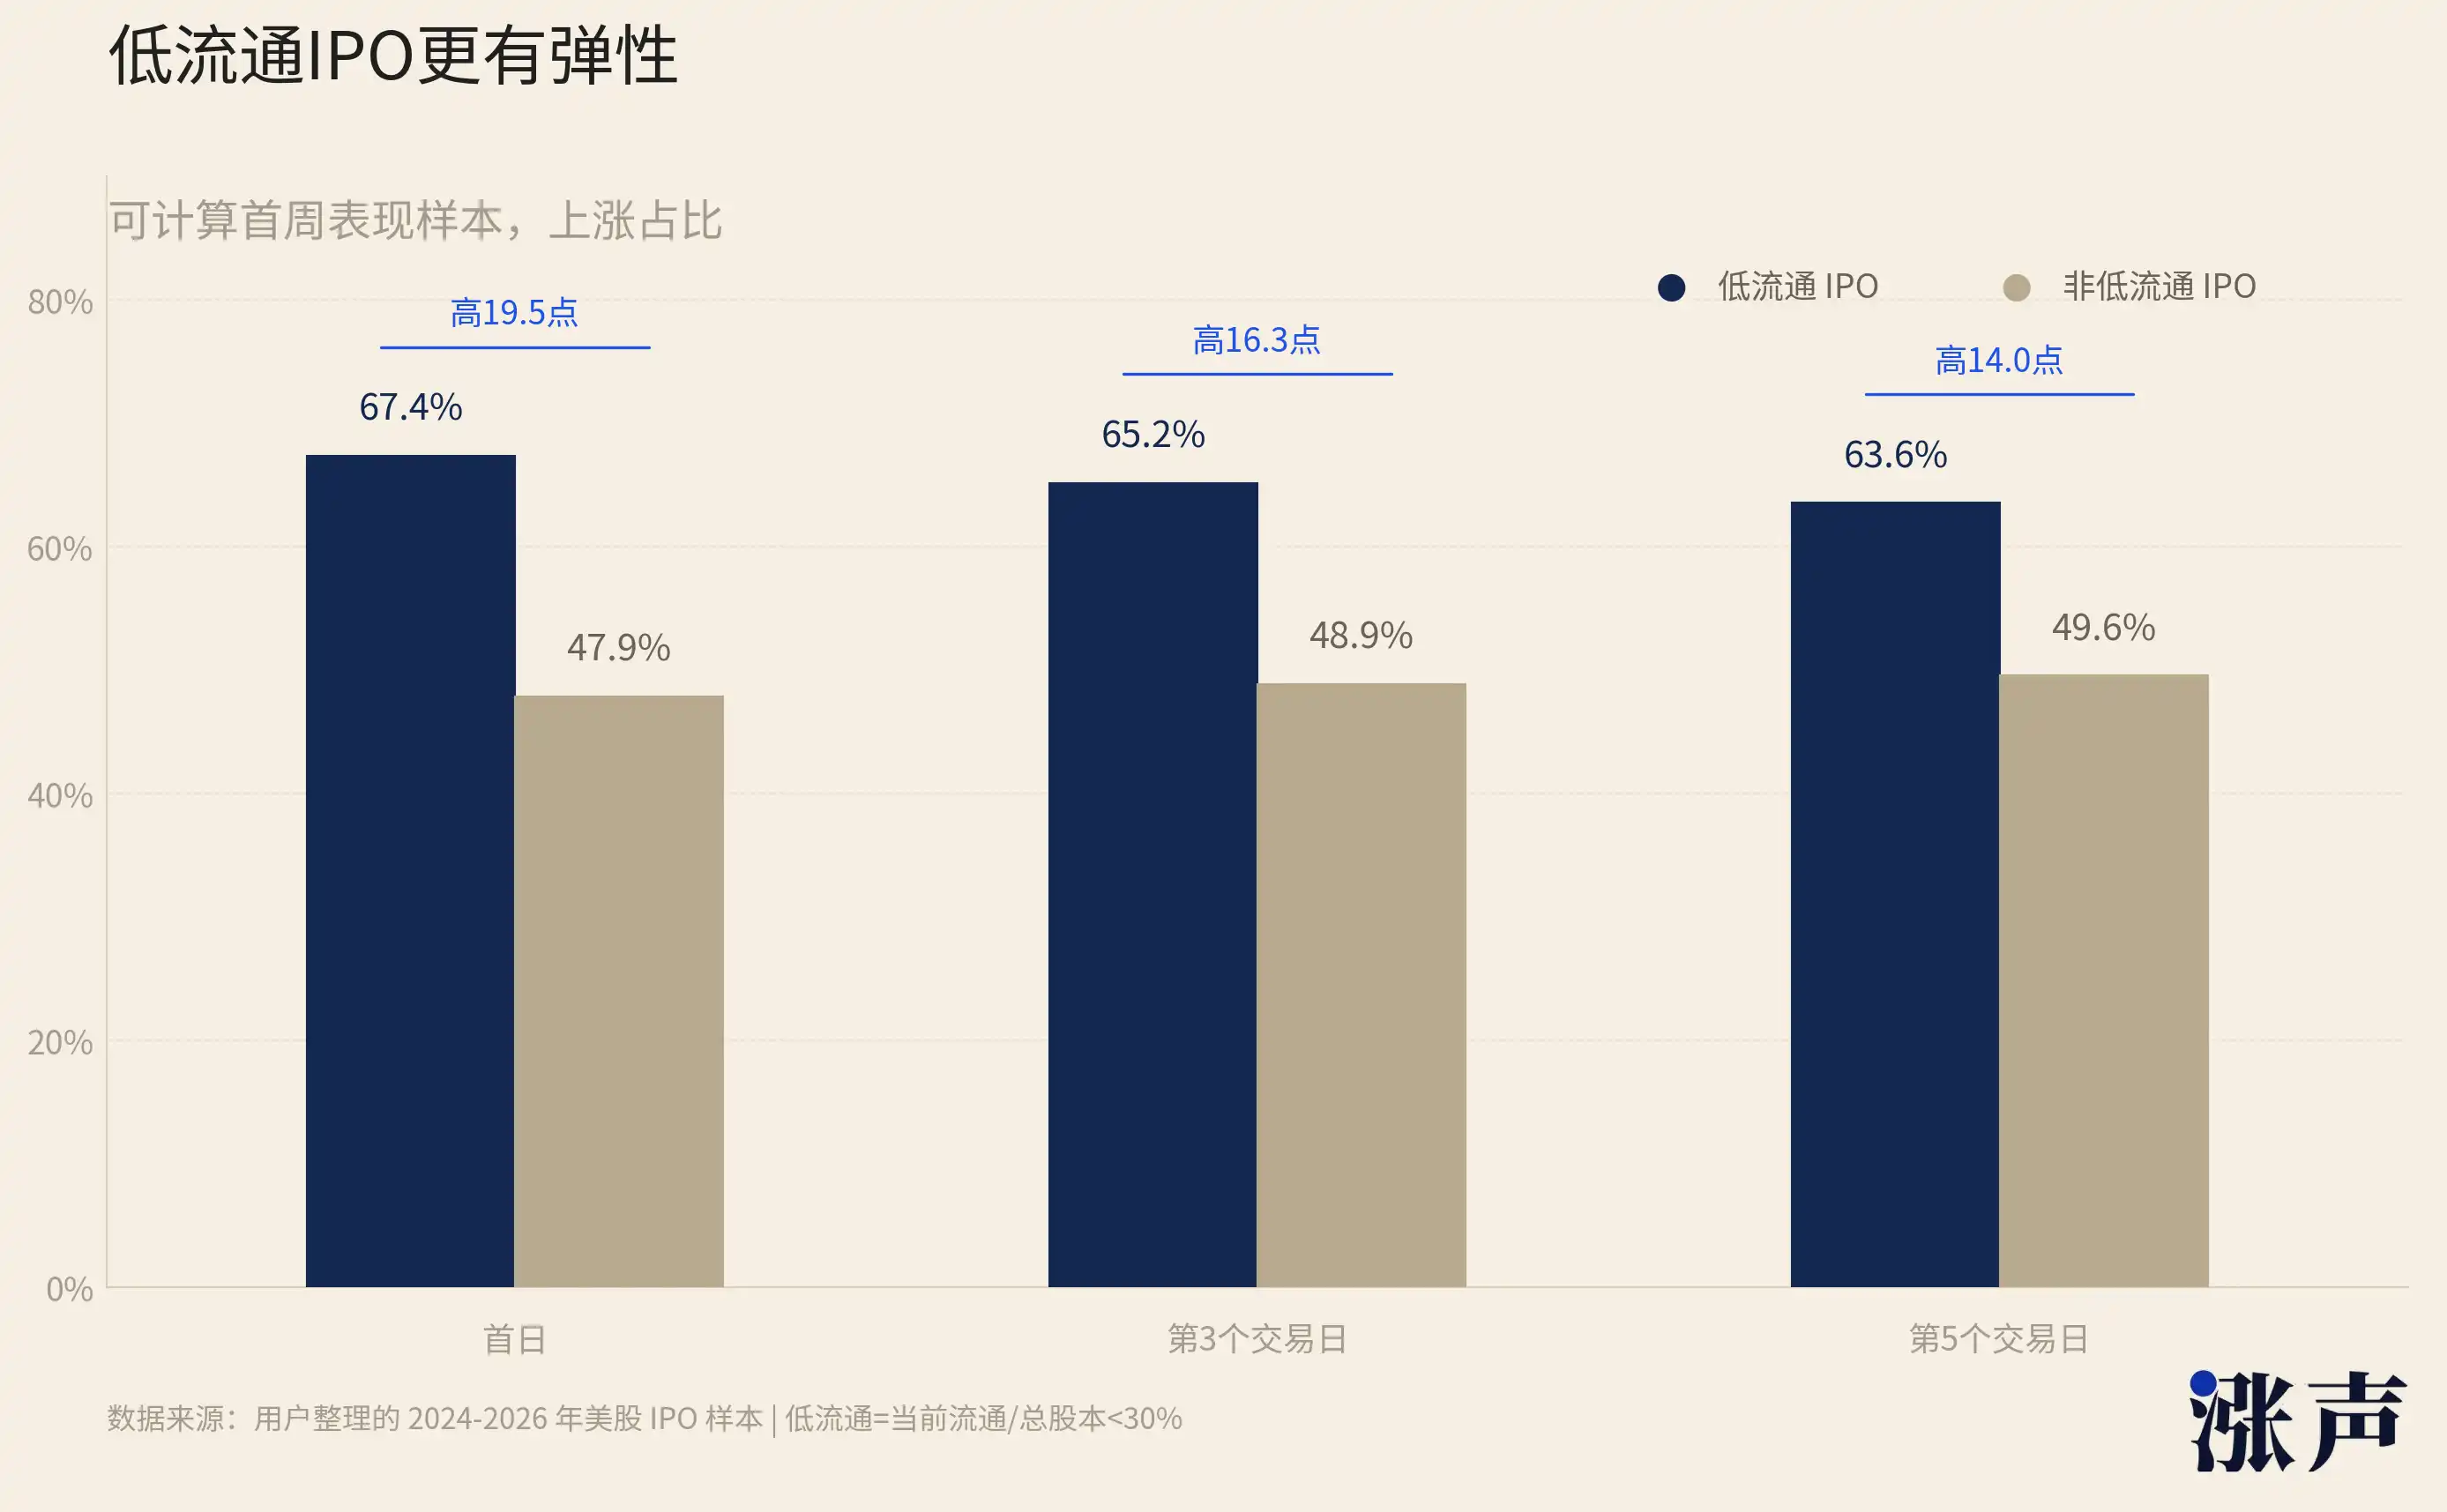
In our analysis of US stock IPOs from 2024 to 2026, we also observed the same pattern. Defining low float as "current float/total shares outstanding less than 30%," in samples where first-week performance could be calculated, low float IPOs saw a first-day increase of 67.4%, a third-day increase of 65.2%, and a fifth-day increase of 63.6%.
The corresponding percentages for non-low float IPOs were only 47.9%, 48.9%, and 49.6%.
With fewer chips available for purchase, the same buying pressure has a greater impact, leading to stronger price elasticity.
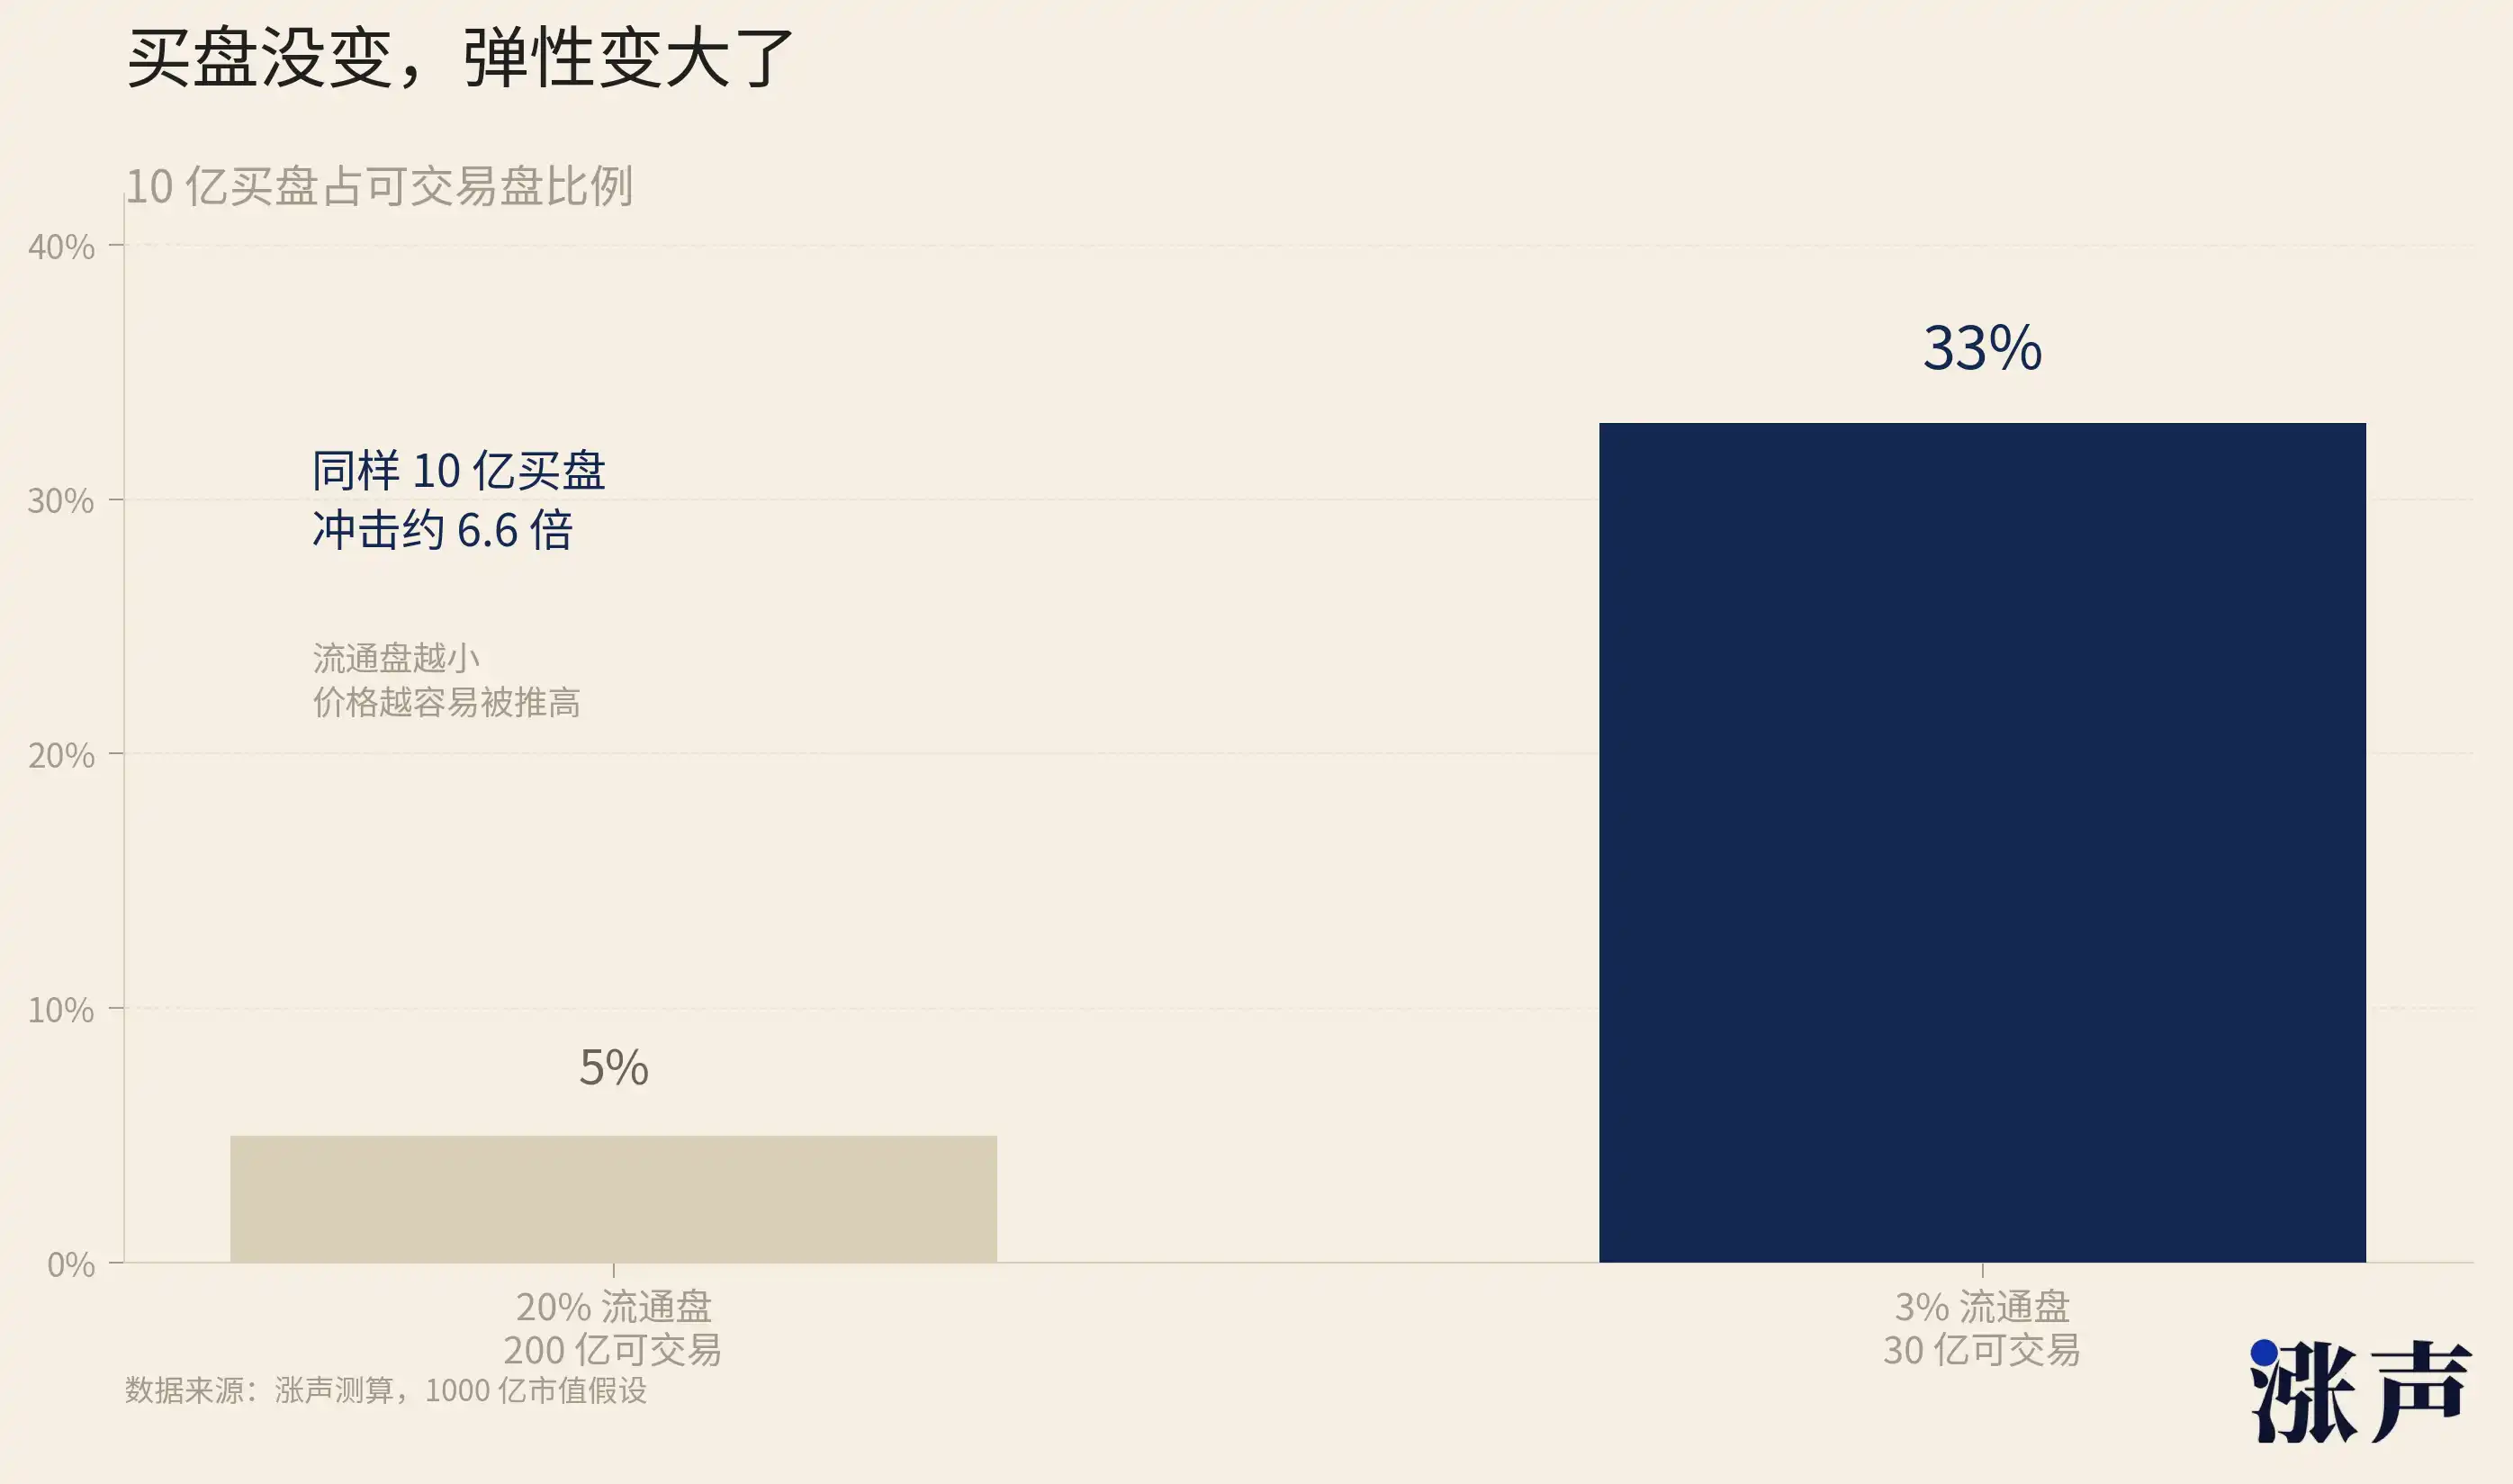
The logic is simple. The same $1 billion buy order is a ripple in a $200 billion free float but a tsunami in a $30 billion free float. As the free float shrinks from 20% to 3%, it's not a linear change but a qualitative shift in price elasticity.
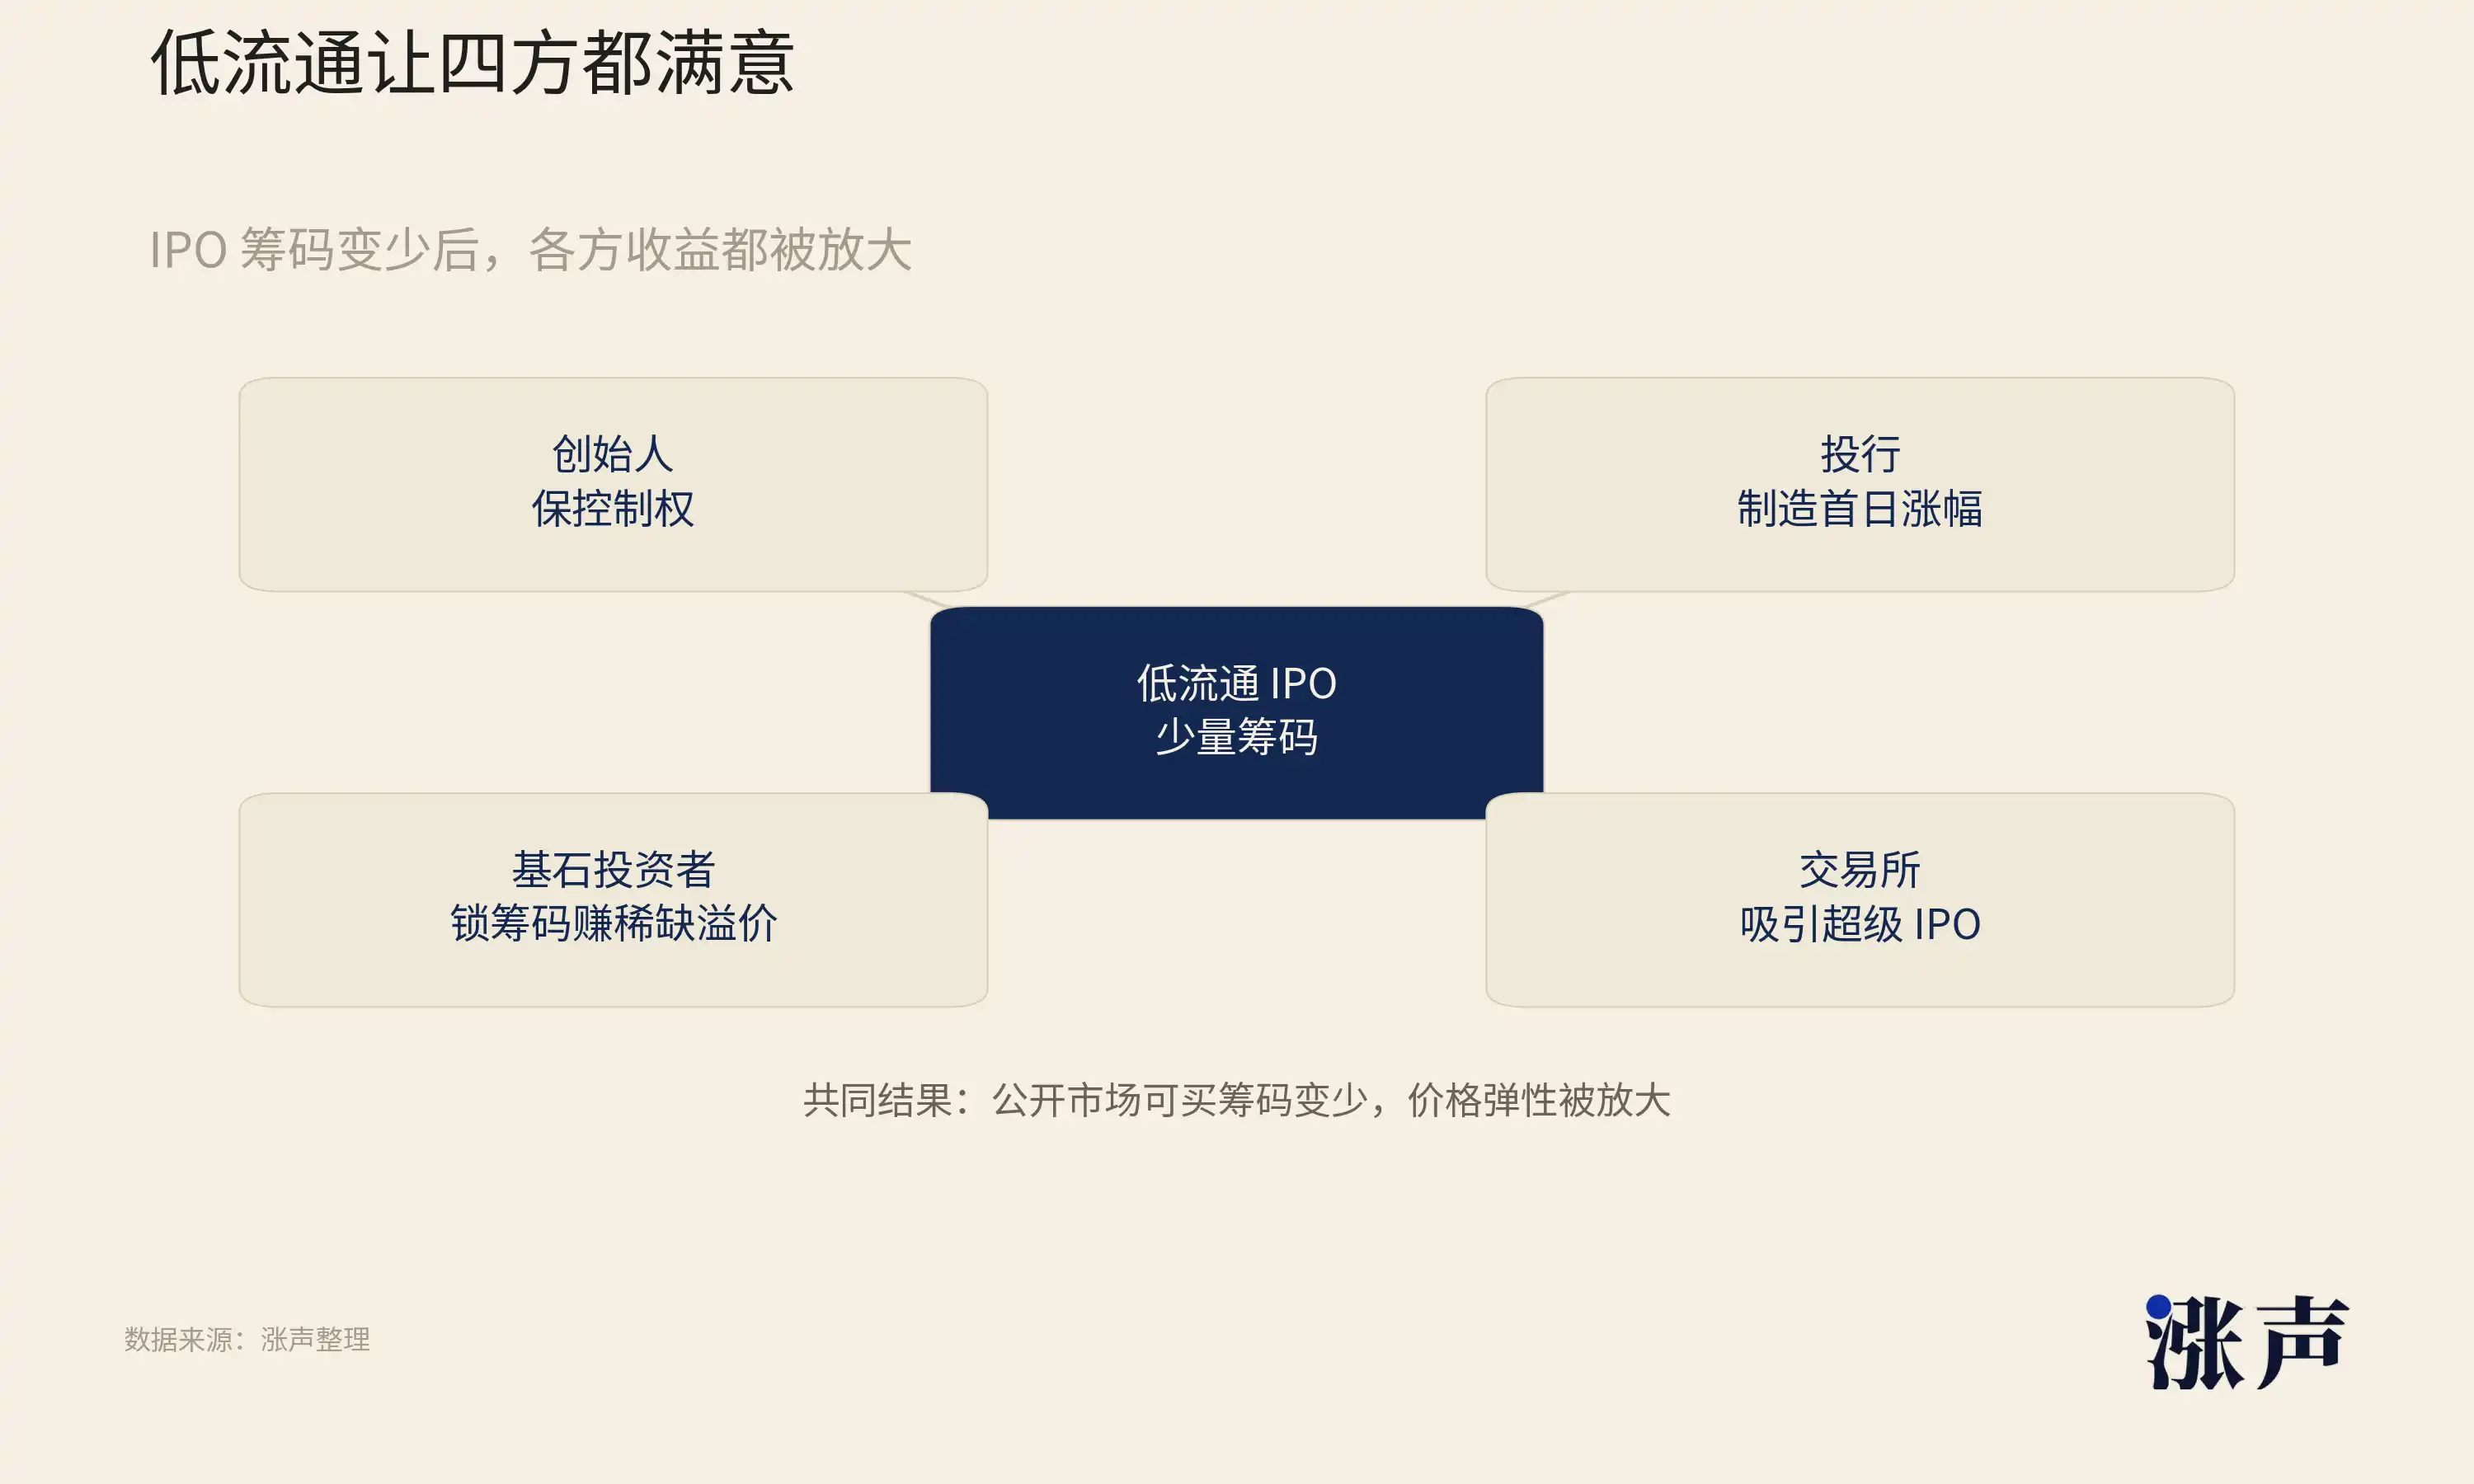
Newly listed companies are increasingly inclined towards low float because this maximizes various interests.
First, let's look at founders. With a smaller free float, control is more secure. Elon Musk of SpaceX holds about 85% of the voting rights through Class B shares, and the 4.3% free float to the public market means external investors have almost no governance influence. He can simultaneously serve as CEO, CTO, and Chairman, merge xAI into SpaceX without shareholder approval, and have complete control over the company's strategic direction. The smaller the free float, the weaker the voice of external shareholders, and the greater the freedom of the founder.
Scarcity also directly drives up market capitalization figures. A company's market cap is not determined by all outstanding shares but by the price of the last trade multiplied by the total shares outstanding. If only 3% of the chips are in play and these chips are bid up to an exorbitant price, the entire company's market cap will be calculated based on this price.
The 97% of shares held by founders and early shareholders that are not actively traded follow suit in paper value expansion. This inflated market cap can be used for fundraising, M&A currency, and talent attraction. When SpaceX went public with a $1.77 trillion valuation, this number would show up in all job postings and be on the table for all partnership negotiations.
This phenomenon is not limited to small-cap stocks.
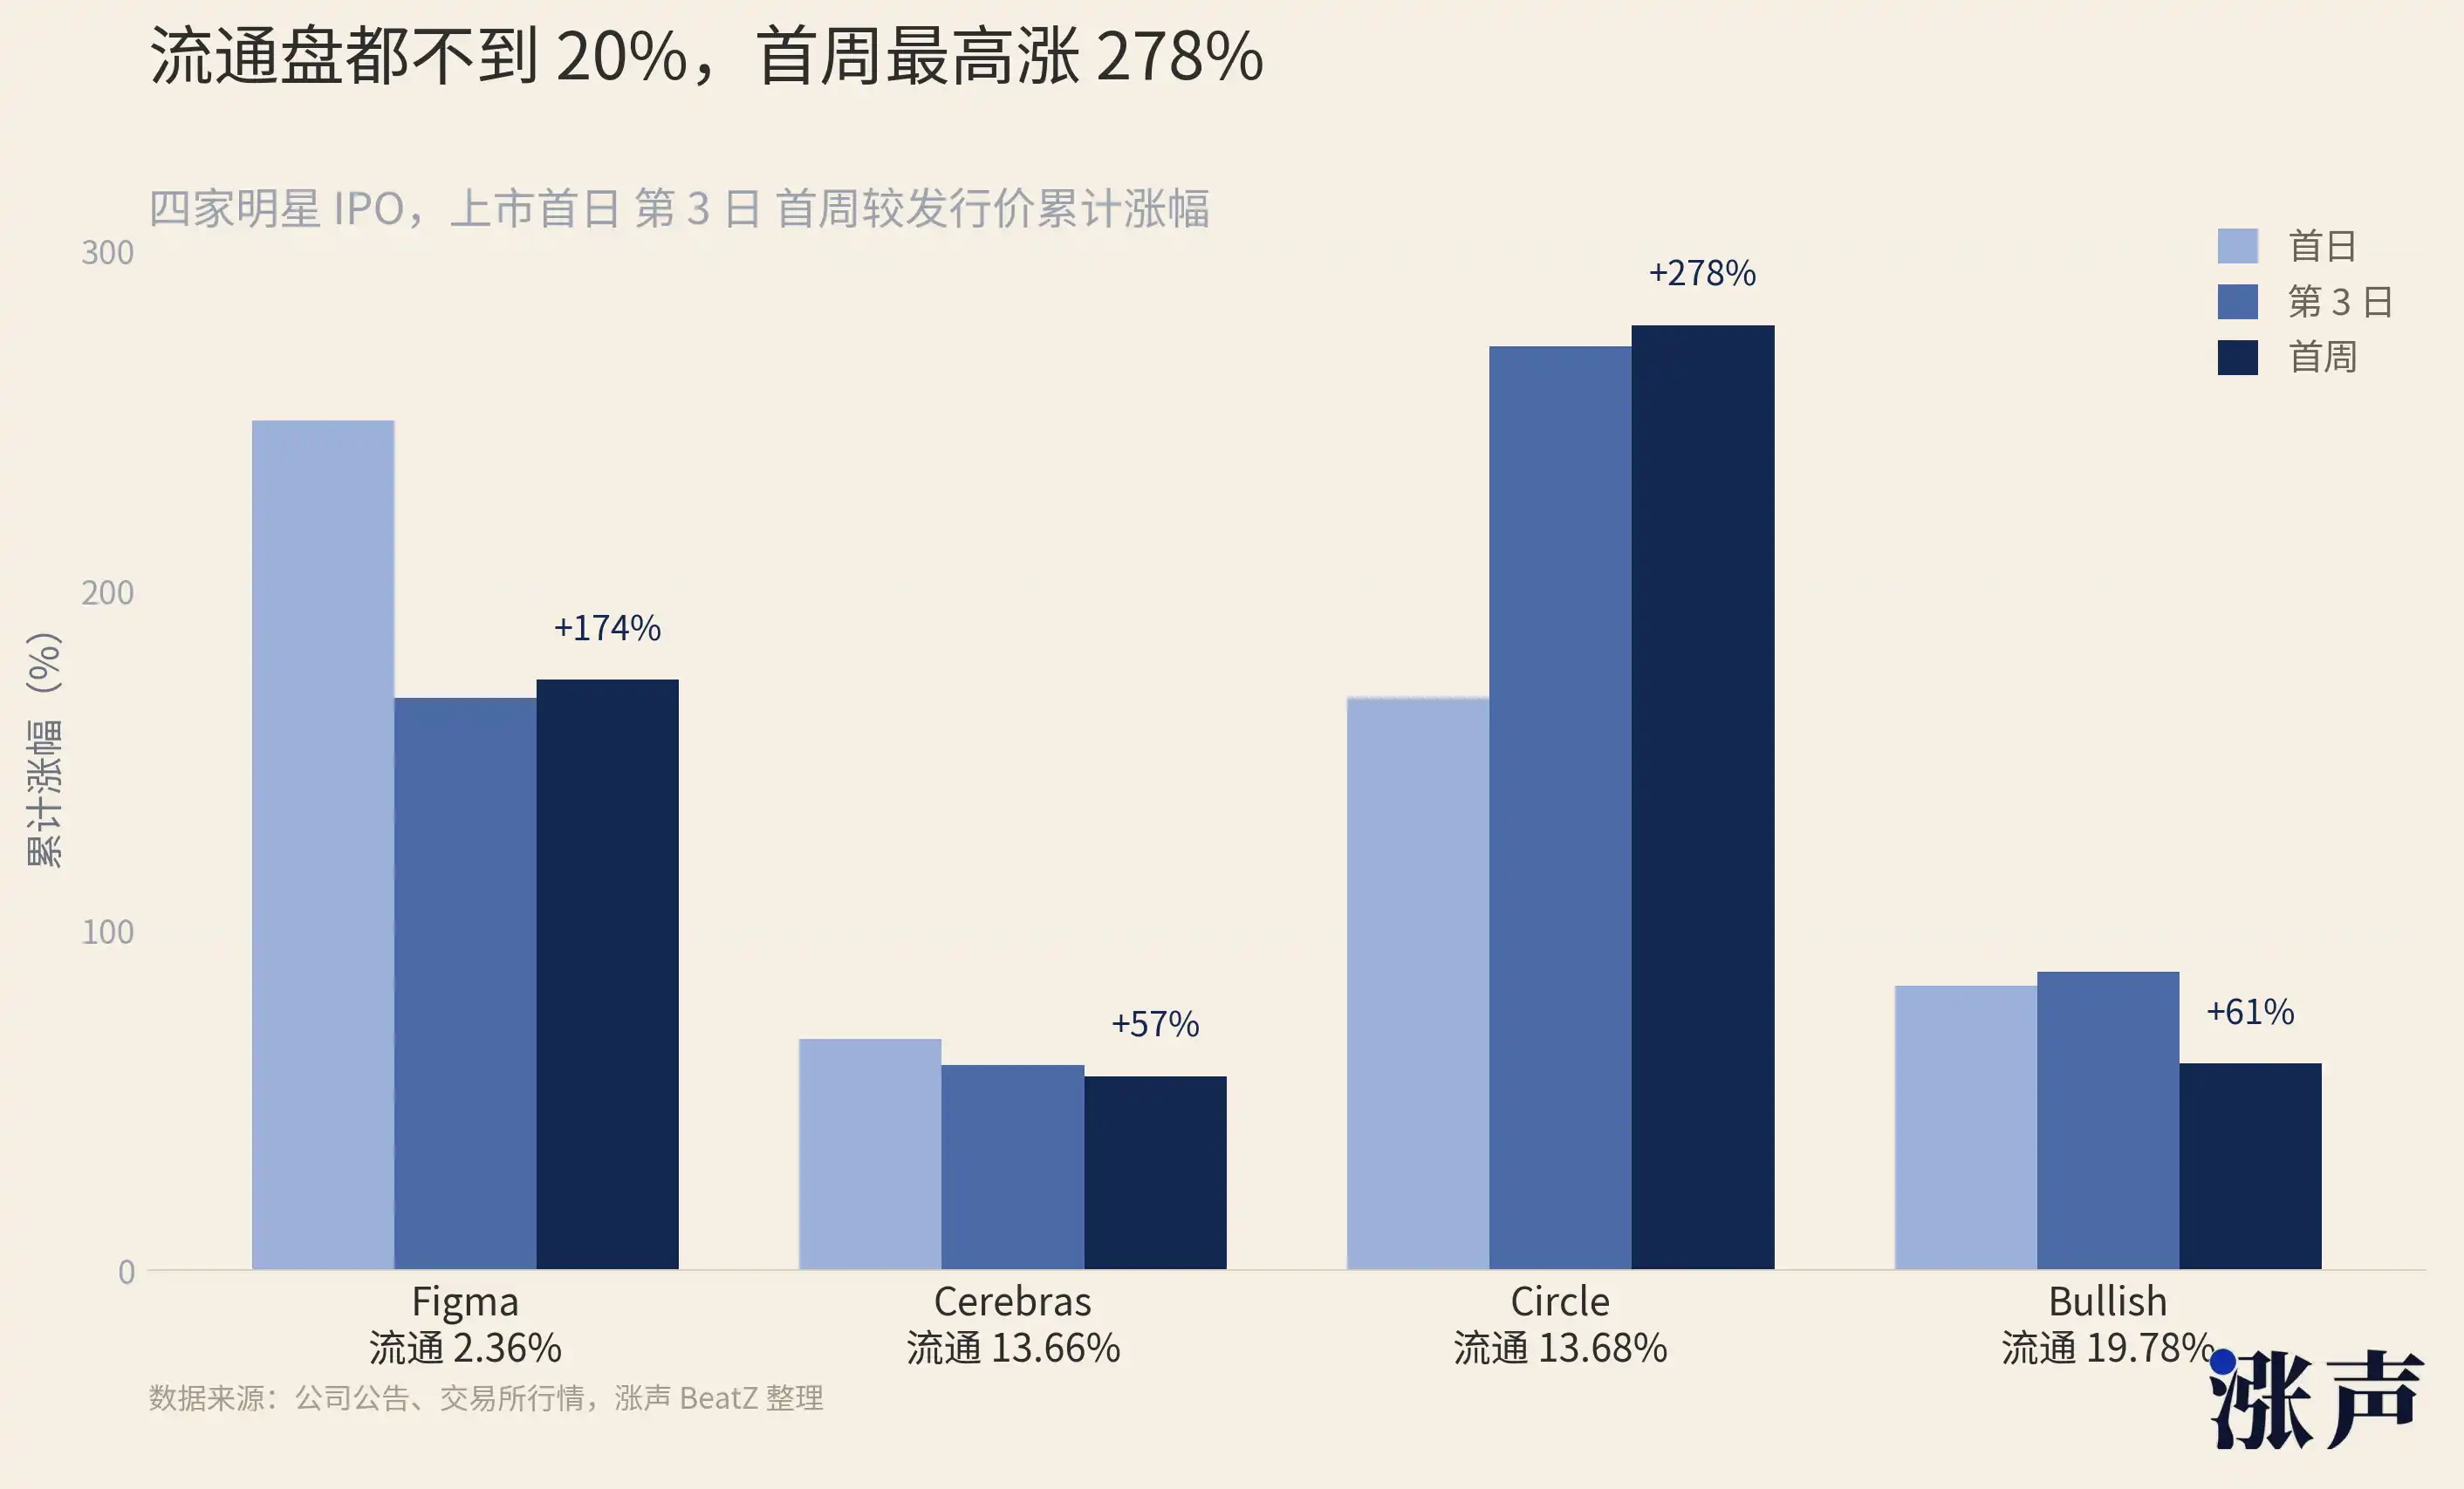
Figma (FIG) is a collaborative design software platform with only 2.36% of its outstanding shares in circulation, rising by 250% on the first day, 168.48% on the third day, and 173.7% in the first week.
Circle (CRCL) is the stablecoin and blockchain financial infrastructure company behind USDC, with 13.68% of its outstanding shares in circulation, seeing an increase of 168.48% on the first day, 271.77% on the third day, and 278.06% in the first week.
Bullish (BLSH) is a digital asset trading platform and market infrastructure company with 19.78% of its outstanding shares in circulation, experiencing an 83.78% increase on the first day, 87.95% on the third day, and 60.84% in the first week.
Cerebras (CBRS) is an AI computing power infrastructure company with 13.66% of its outstanding shares in circulation, rising by 68.15% on the first day, 60.35% on the third day, and 57.13% in the first week.
Now, let's consider investment banks. The IPO "first-day return" is a key metric to measure underwriting success. Media headlines, client evaluations, and the bank's reputation are all linked to this figure. The smaller the float, the easier it is to achieve a significant first-day gain. Goldman Sachs designed a 4.3% float for SpaceX, resulting in a 19% first-day increase, and everyone hailed it as a great IPO. If the float were 20%, with the same scale of buy orders distributed among five times more chips, the increase might only be 4%, leading to completely different media headlines.
The incentive structure of investment banks inherently favors low floats—the smaller the float, the more attractive the first-day return, and the louder the bank's reputation.
Next up are cornerstone investors. The cornerstone investor system in the Hong Kong Stock Exchange is essentially a trade-off: "I'll lock up the chips for you, and you guarantee me an allocation." Cornerstone investors benefit by receiving a fixed IPO share (without worrying about reduced allotments or drawing lots) in exchange for a 6-month lock-up period. However, this cost often turns into a reward—since the cornerstone locks up most of the float, the remaining tradable chips are scarce, making it easy to drive up the stock price.
6 months later, when the lock-up period expires, if the stock price has already increased several times due to its low float, the cornerstone investors will see returns far exceeding a typical IPO. The cornerstone system intertwines the concepts of "supporting the company by locking in shares" and "earning more money for themselves," aligning the interests of both parties perfectly.
Smart Map's 11 cornerstone investors (such as Hillhouse Capital, Taikang Life Insurance, and GF Fund) took away 70% of the already limited number of outstanding shares, resulting in less than 4% of shares available for trading. These shares are all subject to a 6-month lock-up. While they help Smart Map lock up its float, they also create scarcity premium for themselves.
As a result, we can even see a systematic turning point from NASDAQ, abolishing the 10% minimum public float requirement.
This rule had been in place for decades. A listed company was required to have at least 10% of its shares publicly traded to ensure there was enough liquidity in the market and to protect public investors' interests. The S&P 500 is more stringent, requiring a certain level of public float for its constituent stocks. MSCI requires 15%. The Russell series requires 5%.
This precedent has far-reaching implications. If NASDAQ can waive the 10% threshold for SpaceX, what obstacles would the next company, wanting to IPO with only a 3% float, face? If the largest U.S. exchange believes that a low float is acceptable, will other exchanges follow suit? The cornerstone system of the Hong Kong Stock Exchange already allows for the majority of IPO shares to be locked up. If NASDAQ also relaxes its rules, could we see a global competition: exchanges competing to be the most favorable to low floats to attract the best IPO candidates?
Primary Investment, Secondary Hedge: Stock Market Begins to Mirror Crypto's Old Tricks
In the 1990s, as the options market matured, the zero-cost collar became a standard practice for the wealthy. Holding a stock, you would buy a put option to protect the downside (spending money), while simultaneously selling a call option to earn back the cost (receiving money). These actions offset each other, allowing you to lock in a price range without spending money. In the late 1990s, Michael Dell used variable prepaid forwards to cash out a portion of his Dell shares without triggering taxes, reducing his holdings, but still receiving cash in advance.
Previously, this strategy was used by a few ultra-rich individuals and founders, but now, after SpaceX's IPO, wealth management firms openly offer this strategy to thousands of employees, completely changing the scale. Wealth managers like Bernstein and Mercer are now providing guides to SpaceX employees on how to use collars, a level of widespread adoption not seen before.
The Bernstein report contains a set of very sobering data. It looks back at all U.S. stock IPOs over the past decade that raised over $50 million and found that six months after the lock-up period expiration, the median return was a decline of about 10%. One in ten IPOs dropped at least 62% in the six months following the lock-up. The conclusion is quite straightforward: if you are a SpaceX employee holding locked-up shares, statistically speaking, by the time you can sell, the price is likely to be lower than it is now. Therefore, you should use derivatives to lock in gains before the lock-up period ends.
Michael Burry, the individual who famously shorted the U.S. subprime mortgage market in 2008 and made hundreds of millions of dollars, openly stated after SpaceX went public that he had looked into buying put options to short the stock but found the prices prohibitively high. In the end, he neither went long nor short. Even the "Big Short" found the cost of shorting too high, indicating that too many people were attempting the same trade, driving option prices to absurd levels.
In addition to these strategies, whether it's collars, pair trading, or lock-up arbitrage, they all share a common prerequisite: the company is already public. The stock already has a public market price, the option chain is out, and the shorting mechanism is in place.
However, if you have spent a few years in the crypto market, you will find that these changes are not at all surprising.
In 2024, Binance Research, from the largest exchange in the crypto market, released a report titled "Low Float & High FDV: How Did We Get Here?" The report listed a group of tokens that had just been launched, with the lowest circulating supply being only 6% of the total supply and the highest not exceeding 20%.
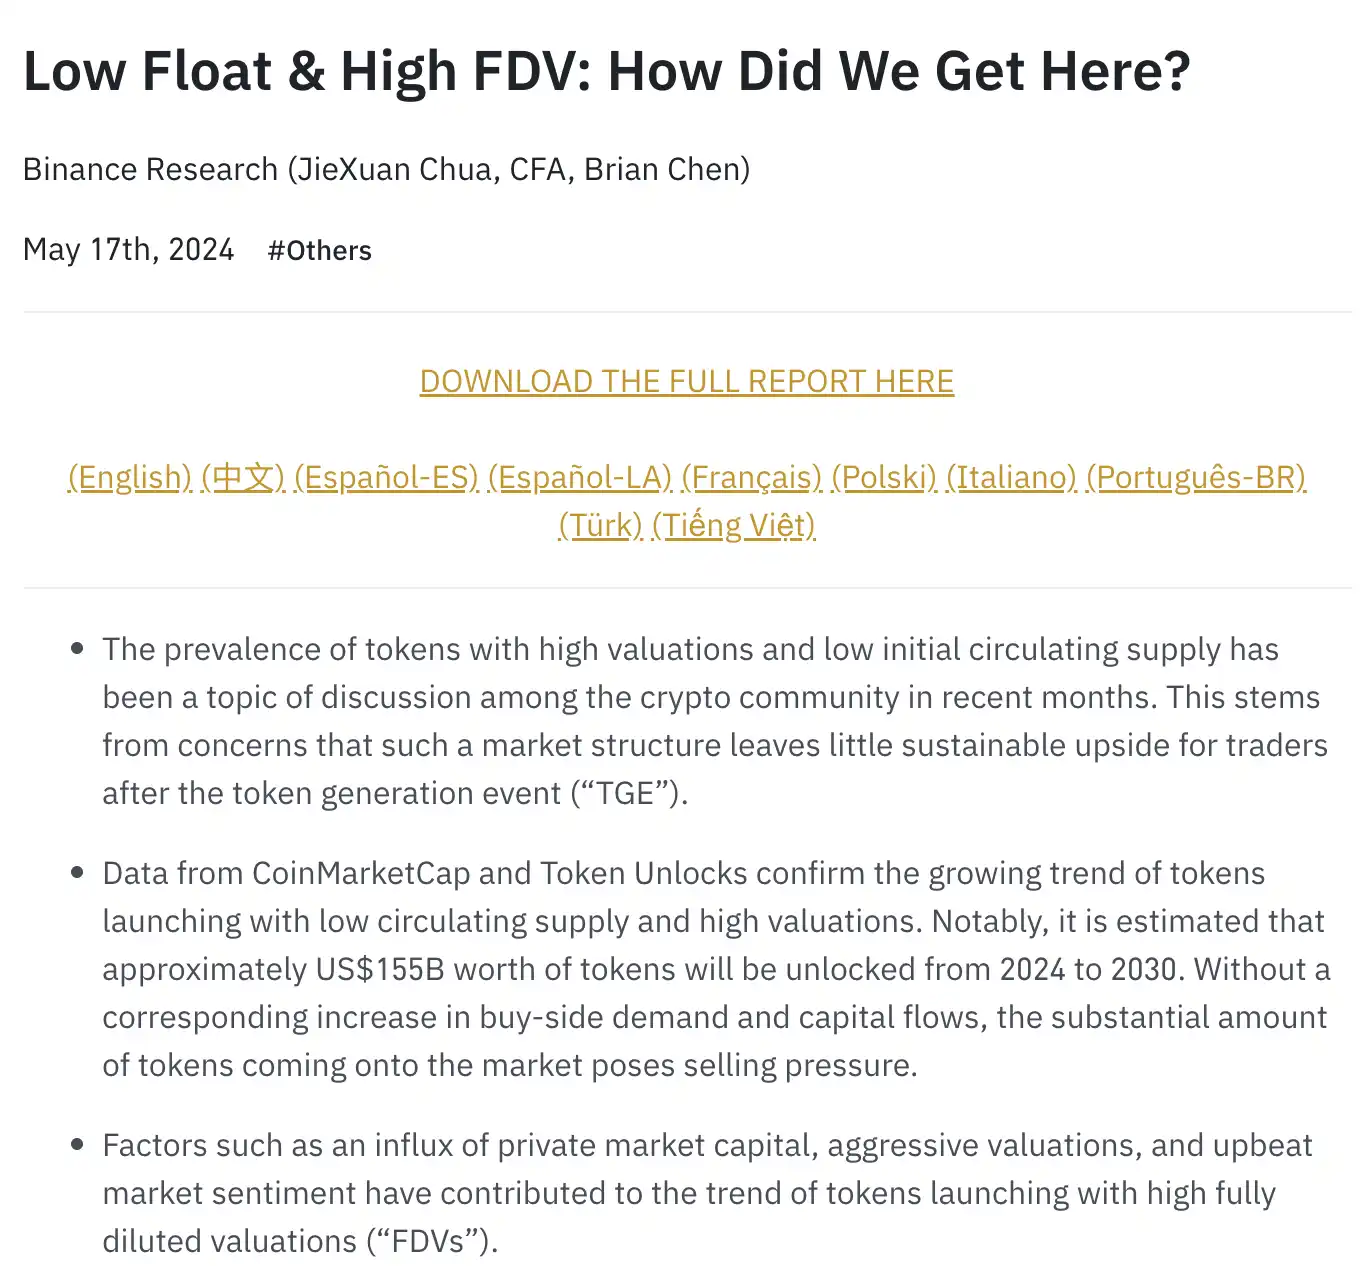
In 2024, the newly issued tokens had the lowest market cap to fully diluted valuation ratio in the past three years. These projects raised their valuations to the sky by releasing only a small amount of chips at launch. These projects at launch initially appeared to have caught up with the market caps of Layer-1 and DeFi blue chips that had been in operation for several years. Then, once the lock-up period ended, the price plummeted.
This is the lesson that the crypto market taught everyone in two years: a low float can drive up the price, but it is not sustainable. Because eventually, the lock-up will be released, and unlocking is the supply. If there is no corresponding demand to absorb it, the price will drop. Binance Research did the math: between 2024 and 2030, an estimated $155 billion worth of tokens are set to unlock gradually. To maintain the current prices of these tokens, the market would need an additional $80 billion in buyer liquidity.
According to data compiled by Memento Research, there were 118 major Token Generation Events (TGEs) in 2025, out of which 100, or 84.7%, are currently trading below their fully diluted valuation at listing. The median drop is 71%.
In its 2025 year-end summary, CryptoRank put it bluntly: "The token issuance model of low circulating supply and high FDV continues to hinder the season of altcoins, as most of the upside potential has been taken by private sale and early investors, leaving very limited opportunities for the open market."
The low circulating supply tokens in the crypto market and low float IPOs in traditional finance have almost identical price formation mechanisms in the early stages of listing: scarce chips, abundant narratives, overwhelming buying pressure far exceeding the tradable supply, pushing prices far above the fundamentals.
So, will the price drops of crypto altcoins be replicated in the stock market?
Not necessarily. After all, the stock market has index passive funds providing continuous buying pressure, deeper institutional involvement, and a more diverse set of funding sources. These are structural supports that the crypto market lacks. This allows low float IPOs in the stock market to rise for months.
Of course, the stock market still cannot avoid the inevitable lock-up expiration day.


Welcome to join the official BlockBeats community:
Telegram Subscription Group: https://t.me/theblockbeats
Telegram Discussion Group: https://t.me/BlockBeats_App
Official Twitter Account: https://twitter.com/BlockBeatsAsia